| |
|
|
|
|
|
|
|
|
|
|
|
|
|
|
|
MONTHLY
ELECTRICITY STATISTICS, March 2007
- 16 |
|
|
|
|
|
|
|
|
|
|
|
|
|
|
|
|
|
|
|
|
|
|
|
|
|
|
|
|
|
|
|
|
|
|
|
|
|
|
|
|
|
|
|
|
|
|
|
|
|
|
|
|
|
|
|
|
|
|
|
|
|
|
|
|
|
|
|
|
|
|
|
|
|
|
|
|
|
|
|
|
|
|
|
|
|
|
|
|
|
|
|
|
|
|
|
|
|
|
|
|
|
|
|
|
|
|
|
|
|
|
| HUNGARY |
|
|
|
|
|
|
|
|
|
|
|
|
|
|
|
GWh |
|
|
|
| |
Mar/07 |
Mar/06 |
The last 3 months |
Year-to-Date |
Past Year |
|
|
| |
|
|
% change |
|
Dec/06 |
|
Jan/07 |
|
Feb/07 |
|
Jan-Mar 2007 |
|
% change |
|
2006 |
|
|
|
| |
|
|
|
|
|
|
|
|
|
|
|
|
| +
Combustible Fuels |
2 092 |
|
4.9% |
|
2 006 |
|
2 053 |
|
1 791 |
|
5 936 |
|
7.3% |
|
20 449 |
|
61.6% |
|
|
| + Nuclear |
966 |
|
4.4% |
|
1 001 |
|
1 328 |
|
1 192 |
|
3 486 |
|
6.4% |
|
12 516 |
|
37.7% |
|
|
| + Hydro |
8 |
|
33.3% |
|
19 |
|
11 |
|
4 |
|
23 |
|
-36.1% |
|
185 |
|
0.6% |
|
|
| + Geoth./Wind/Solar/Other |
4 |
|
0.0% |
|
5 |
|
4 |
|
4 |
|
12 |
|
9.1% |
|
44 |
|
0.1% |
|
|
| = Indigenous Production |
3 070 |
|
4.8% |
|
3 031 |
|
3 396 |
|
2 991 |
|
9 457 |
|
6.8% |
|
33 194 |
|
100.0% |
|
|
| + Imports |
1 357 |
|
-0.6% |
|
1 579 |
|
1 491 |
|
1 364 |
|
4 212 |
|
-0.8% |
|
15 392 |
|
|
|
|
| - Exports |
970 |
|
31.8% |
|
1 072 |
|
1 303 |
|
1 113 |
|
3 386 |
|
35.0% |
|
8 185 |
|
|
|
|
| |
|
|
|
|
|
|
|
|
|
|
|
|
|
|
|
|
|
|
|
| |
|
|
|
|
|
|
|
|
|
|
|
|
|
|
|
|
|
|
|
| = Electricity Supplied |
3 457 |
|
-2.9% |
|
3 538 |
|
3 584 |
|
3 242 |
|
10 283 |
|
-2.9% |
|
40 401 |
|
|
|
|
| |
|
|
|
|
|
|
|
|
|
|
|
|
|
|
|
|
|
|
| |
|
|
|
|
|
|
|
|
Period |
Date |
|
|
|
|
|
|
|
|
|
|
|
|
|
|
|
|
|
|
|
|
|
|
|
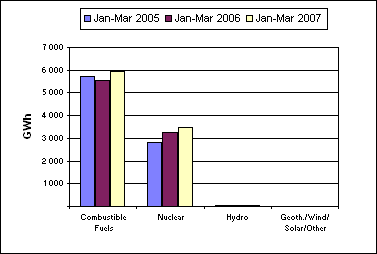
| - Electricity production was 3 070 GWh in
March 2007. |
|
|
|
| -
This was higher by 140 GWh, or 4.8 %, compared to March 2006. |
|
|
|
| -
This was an increase of 79 GWh, or 2.6 %, compared to the previous month. |
|
|
|
| -
Hydro production showed the most significant percentage change compared to
the previous month with |
|
|
| an increase of 100 %, or 4 GWh. |
|
|
|
|
|
|
|
|
|
|
|
|
|
|
|
| -
Total production for the year-to-date was 9 457 GWh. Comparing this to the
same period last year shows that: |
|
|
| - Total
production was higher by 601 GWh, or 6.8 %. |
|
|
|
| -
Hydro production showed the largest percentage change by fuel type, being
36.1 % lower. |
|
|
| - Trade volume increased by 843 GWh, or 12.5
%. |
|
|
|
|
|
|
|
|
|
|
|
|
|
|
|
|
|
| Electricity
Production Compared to Previous Year |
'Year to Date'
Comparison of Production by Fuel Type |
|
|
|
  |
|
|
|
|
|
|
|
|
|
|
|
|
|
|
|
|
|
|
|
|
|
|
|
|
|
|
|
|
|
|
|
|
|
|
|
|
|
|
|
|
|
|
|
|
|
|
|
|
|
|
|
|
|
|
|
|
|
|
|
|
|
|
|
|
|
|
|
|
|
|
|
|
|
|
|
|
| COUNTRY NOTES: |
|
|
|
|
|
|
|
| Net
production is estimated from monthly submission of gross production. |
|
|
|
|
|
|
|
|
|
|
|
|
|
|
|
|
|
|
|
|
|
|
|
|
|
|
|
|
|
|
|
|
|
|
|
|
|
|
|
|
|
|
|
|
|
|
|
|
| © OECD/IEA, 2007 |
|
|
|
|
|
|
|
|
|
|
|
|
|
|
|
INTERNATIONAL ENERGY AGENCY |
|
|
|
|
|
|
|
|
|
|
|
|
|
|
|
|
|
|
|
|
|
|
|
|
|
|
|
|
|
|
|
|
|
|
|
|
|
|
|
|
|
|
|
|
|
|
|
|
|
|
|
|
|
|
|
|
|
|
|
|
|
|
|
|
|
|
|
|
|
|
|
|
|
|
|
|
|
|
|
|
|
|
|
|
|
|
|
|
|
|
|
|
|
|
|
|
|
|
|
|
|
|
|
|
|
|
|
|
|
|
|
|
|
|
|
|
|
|
|
|
|
|
|
|
|
|
|
|
|
|
|
|
|
|
|
|
|
|
|
|
|
|
|
|
|
|
|
|
|
|
|
|
|
|
|
|
|
|
|
|
|
|
|
|
|
|
|
|
|
|
|
|
|
|
|
|
|
|
|
|
|
|
|
|
|
|
|
|
|
|
|
|
|
|
|
|
|
|
|
|
|
|
|
|
|
|
|
|
|
|
|
|
|
|
|
|
|
|
|
|
|
|
|
|
|
|
|
|
|
|
|
|
|
|
|
|
|
|
|
|
|
|
|
|
|
|
|
|
|
|
|
|
|
|
|
|
|
|
|
|
|
|
|
|
|
|
|
|
|
|
|
|
|
|
|
|
|
|
|
|
|
|
|
|
|
|
|
|
|
|
|
|
|
|
|
|
|
|
|
|
|
|
|
|
|
|
|
|
|
|
|
|
|
|
|
|
|
|
|
|
|
|
|
|
|
|
|
|
|
|
|
|
|
|
|
|
|
|
|
|
|
|
|
|
|
|
|
|
|
|
|
|
|
|
|
|
|
|
|
|
|
|
|
|
|
|
|
|
|
|
|
|
|
|
|
|
|
|
|
|
|
|
|
|
|
|
|
|
|
|
|
|
|
|
|
|
|
|
|
|
|
|
|
|
|
|
|
|
|
|
|
|
|
|
|
|
|
|
|
|
|
|
|
|
|
|
|
|
|
|
|
|
|
|