| |
|
|
|
|
|
|
|
|
|
|
|
|
|
|
|
MONTHLY
ELECTRICITY STATISTICS, March 2007
- 27 |
|
|
|
|
|
|
|
|
|
|
|
|
|
|
|
|
|
|
|
|
|
|
|
|
|
|
|
|
|
|
|
|
|
|
|
|
|
|
|
|
|
|
|
|
|
|
|
|
|
|
|
|
|
|
|
|
|
|
|
|
|
|
|
|
|
|
|
|
|
|
|
|
|
|
|
|
|
|
|
|
|
|
|
|
|
|
|
|
|
|
|
|
|
|
|
|
|
|
|
|
|
|
|
|
|
|
|
|
|
|
| POLAND |
|
|
|
|
|
|
|
|
|
|
|
|
|
|
|
GWh |
|
|
|
| |
Mar/07 |
Mar/06 |
The last 3 months |
Year-to-Date |
Past Year |
|
|
| |
|
|
% change |
|
Dec/06 |
|
Jan/07 |
|
Feb/07 |
|
Jan-Mar 2007 |
|
% change |
|
2006 |
|
|
|
| |
|
|
|
|
|
|
|
|
|
|
|
|
| +
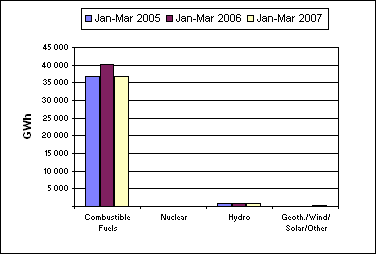
Combustible Fuels |
11 918 |
|
-10.4% |
|
12 923 |
|
12 915 |
|
11 940 |
|
36 773 |
|
-8.8% |
|
144 394 |
|
97.8% |
|
|
| + Nuclear |
0 |
|
0.0% |
|
0 |
|
0 |
|
0 |
|
0 |
|
0.0% |
|
0 |
|
0.0% |
|
|
| + Hydro |
325 |
|
15.2% |
|
229 |
|
259 |
|
281 |
|
865 |
|
12.8% |
|
2 996 |
|
2.0% |
|
|
| + Geoth./Wind/Solar/Other |
42 |
|
133.3% |
|
49 |
|
69 |
|
39 |
|
150 |
|
240.9% |
|
254 |
|
0.2% |
|
|
| = Indigenous Production |
12 285 |
|
-9.7% |
|
13 201 |
|
13 243 |
|
12 260 |
|
37 788 |
|
-8.1% |
|
147 644 |
|
100.0% |
|
|
| + Imports |
930 |
|
126.8% |
|
707 |
|
846 |
|
630 |
|
2 406 |
|
79.3% |
|
4 789 |
|
|
|
|
| - Exports |
1 161 |
|
-26.2% |
|
1 522 |
|
1 333 |
|
1 302 |
|
3 796 |
|
-24.2% |
|
15 775 |
|
|
|
|
| |
|
|
|
|
|
|
|
|
|
|
|
|
|
|
|
|
|
|
|
| |
|
|
|
|
|
|
|
|
|
|
|
|
|
|
|
|
|
|
|
| = Electricity Supplied |
12 054 |
|
-3.1% |
|
12 386 |
|
12 756 |
|
11 588 |
|
36 398 |
|
-2.8% |
|
136 658 |
|
|
|
|
| |
|
|
|
|
|
|
|
|
|
|
|
|
|
|
|
|
|
|
| |
|
|
|
|
|
|
|
|
Period |
Date |
|
|
|
|
|
|
|
|
|
|
|
|
|
|
|
|
|
|
|
|
|
|
|
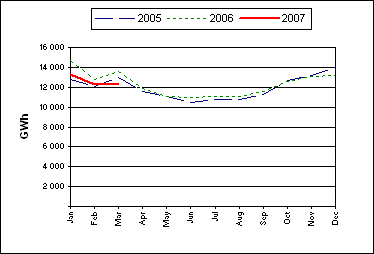
| - Electricity production was 12 285 GWh in
March 2007. |
|
|
|
| -
This was lower by 1 320 GWh, or 9.7 %, compared to March 2006. |
|
|
|
| -
This was an increase of 25 GWh, or 0.2 %, compared to the previous month. |
|
|
|
| -
Hydro production showed the most significant percentage change compared to
the previous month with |
|
|
| an increase of 15.7 %, or 44 GWh. |
|
|
|
|
|
|
|
|
|
|
|
|
|
|
|
| -
Total production for the year-to-date was 37 788 GWh. Comparing this to the
same period last year shows that: |
|
|
| - Total
production was lower by 3 328 GWh, or 8.1 %. |
|
|
|
| -
Geoth./Wind/Solar/Other production showed the largest percentage change by
fuel type, being 240.9 % higher. |
|
|
| - Trade volume decreased by 146 GWh, or 2.3
%. |
|
|
|
|
|
|
|
|
|
|
|
|
|
|
|
|
|
| Electricity
Production Compared to Previous Year |
'Year to Date'
Comparison of Production by Fuel Type |
|
|
|
|
|
|
|
|
|
|
|
|
|
|
|
|
|
|
|
|
|
|
|
|
|
|
|
|
|
|
|
|
|
|
|
|
|
|
|
|
|
|
|
|
|
|
|
|
|
|
|
|
|
|
|
|
|
|
|
|
|
|
|
|
|
|
|
|
|
|
|
|
|
|
|
|
|
|
|
|
| COUNTRY NOTES: |
|
|
|
|
|
|
|
| Geoth./Wind/Solar/Other
production is estimated by the IEA Secretariat. |
|
|
|
|
|
|
|
|
|
|
|
|
|
|
|
|
|
|
|
|
|
|
|
|
|
|
|
|
|
|
|
|
|
|
|
|
|
|
|
|
|
|
|
|
|
|
|
|
| © OECD/IEA, 2007 |
|
|
|
|
|
|
|
|
|
|
|
|
|
|
|
INTERNATIONAL ENERGY AGENCY |
|
|
|
|
|
|
|
|
|
|
|
|
|
|
|
|
|
|
|
|
|
|
|
|
|
|
|
|
|
|
|
|
|
|
|
|
|
|
|
|
|
|
|
|
|
|
|
|
|
|
|
|
|
|
|
|
|
|
|
|
|
|
|
|
|
|
|
|
|
|
|
|
|
|
|
|
|
|
|
|
|
|
|
|
|
|
|
|
|
|
|
|
|
|
|
|
|
|
|
|
|
|
|
|
|
|
|
|
|
|
|
|
|
|
|
|
|
|
|
|
|
|
|
|
|
|
|
|
|
|
|
|
|
|
|
|
|
|
|
|
|
|
|
|
|
|
|
|
|
|
|
|
|
|
|
|
|
|
|
|
|
|
|
|
|
|
|
|
|
|
|
|
|
|
|
|
|
|
|
|
|
|
|
|
|
|
|
|
|
|
|
|
|
|
|
|
|
|
|
|
|
|
|
|
|
|
|
|
|
|
|
|
|
|
|
|
|
|
|
|
|
|
|
|
|
|
|
|
|
|
|
|
|
|
|
|
|
|
|
|
|
|
|
|
|
|
|
|
|
|
|
|
|
|
|
|
|
|
|
|
|
|
|
|
|
|
|
|
|
|
|
|
|
|
|
|
|
|
|
|
|
|
|
|
|
|
|
|
|
|
|
|
|
|
|
|
|
|
|
|
|
|
|
|
|
|
|
|
|
|
|
|
|
|
|
|
|
|
|
|
|
|
|
|
|
|
|
|
|
|
|
|
|
|
|
|
|
|
|
|
|
|
|
|
|
|
|
|
|
|
|
|
|
|
|
|
|
|
|
|
|
|
|
|
|
|
|
|
|
|
|
|
|
|
|
|
|
|
|
|
|
|
|
|
|
|
|
|
|
|
|
|
|
|
|
|
|
|
|
|
|
|
|
|
|
|
|
|
|
|
|
|
|
|
|
|
|
|
|
|
|
|
|
|
|
|
|
|
|
|
|
|
|
|