| |
|
|
|
|
|
|
|
|
|
|
|
|
|
|
|
MONTHLY
ELECTRICITY STATISTICS, March 2007
- 33 |
|
|
|
|
|
|
|
|
|
|
|
|
|
|
|
|
|
|
|
|
|
|
|
|
|
|
|
|
|
|
|
|
|
|
|
|
|
|
|
|
|
|
|
|
|
|
|
|
|
|
|
|
|
|
|
|
|
|
|
|
|
|
|
|
|
|
|
|
|
|
|
|
|
|
|
|
|
|
|
|
|
|
|
|
|
|
|
|
|
|
|
|
|
|
|
|
|
|
|
|
|
|
|
|
|
|
|
|
|
|
| TURKEY |
|
|
|
|
|
|
|
|
|
|
|
|
|
|
|
GWh |
|
|
|
| |
Mar/07 |
Mar/06 |
The last 3 months |
Year-to-Date |
Past Year |
|
|
| |
|
|
% change |
|
Dec/06 |
|
Jan/07 |
|
Feb/07 |
|
Jan-Mar 2007 |
|
% change |
|
2006 |
|
|
|
| |
|
|
|
|
|
|
|
|
|
|
|
|
| +
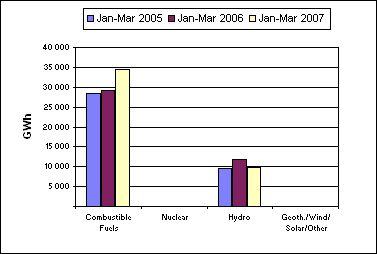
Combustible Fuels |
11 921 |
|
19.2% |
|
11 690 |
|
11 560 |
|
11 001 |
|
34 482 |
|
18.4% |
|
125 007 |
|
74.0% |
|
|
| + Nuclear |
0 |
|
0.0% |
|
0 |
|
0 |
|
0 |
|
0 |
|
0.0% |
|
0 |
|
0.0% |
|
|
| + Hydro |
3 148 |
|
-22.0% |
|
3 734 |
|
3 751 |
|
2 889 |
|
9 788 |
|
-16.4% |
|
43 789 |
|
25.9% |
|
|
| + Geoth./Wind/Solar/Other |
43 |
|
207.1% |
|
22 |
|
29 |
|
30 |
|
102 |
|
137.2% |
|
211 |
|
0.1% |
|
|
| = Indigenous Production |
15 112 |
|
7.6% |
|
15 446 |
|
15 340 |
|
13 920 |
|
44 372 |
|
8.5% |
|
169 007 |
|
100.0% |
|
|
| + Imports |
58 |
|
26.1% |
|
62 |
|
65 |
|
57 |
|
180 |
|
29.5% |
|
575 |
|
|
|
|
| - Exports |
239 |
|
25.1% |
|
267 |
|
253 |
|
178 |
|
670 |
|
14.3% |
|
2 235 |
|
|
|
|
| |
|
|
|
|
|
|
|
|
|
|
|
|
|
|
|
|
|
|
|
| |
|
|
|
|
|
|
|
|
|
|
|
|
|
|
|
|
|
|
|
| = Electricity Supplied |
14 931 |
|
7.4% |
|
15 241 |
|
15 152 |
|
13 799 |
|
43 882 |
|
8.5% |
|
167 347 |
|
|
|
|
| |
|
|
|
|
|
|
|
|
|
|
|
|
|
|
|
|
|
|
| |
|
|
|
|
|
|
|
|
Period |
Date |
|
|
|
|
|
|
|
|
|
|
|
|
|
|
|
|
|
|
|
|
|
|
|
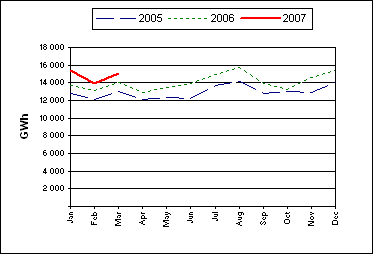
| - Electricity production was 15 112 GWh in
March 2007. |
|
|
|
| -
This was higher by 1 066 GWh, or 7.6 %, compared to March 2006. |
|
|
|
| -
This was an increase of 1 192 GWh, or 8.6 %, compared to the previous month. |
|
|
| -
Geoth./Wind/Solar/Other production showed the most significant percentage
change compared to the previous month |
|
|
| with an increase of 43.3 %,
or 13 GWh. |
|
|
|
|
|
|
|
|
|
|
|
|
|
|
|
| -
Total production for the year-to-date was 44 372 GWh. Comparing this to the
same period last year shows that: |
|
|
| - Total
production was higher by 3 481 GWh, or 8.5 %. |
|
|
|
| -
Geoth./Wind/Solar/Other production showed the largest percentage change by
fuel type, being 137.2 % higher. |
|
|
| - Trade volume increased by 125 GWh, or 17.2
%. |
|
|
|
|
|
|
|
|
|
|
|
|
|
|
|
|
|
| Electricity
Production Compared to Previous Year |
'Year to Date'
Comparison of Production by Fuel Type |
|
|
|
|
|
|
|
|
|
|
|
|
|
|
|
|
|
|
|
|
|
|
|
|
|
|
|
|
|
|
|
|
|
|
|
|
|
|
|
|
|
|
|
|
|
|
|
|
|
|
|
|
|
|
|
|
|
|
|
|
|
|
|
|
|
|
|
|
|
|
|
|
|
|
|
|
|
|
|
|
| COUNTRY NOTES: |
|
|
|
|
|
|
|
| Net
production is estimated from monthly submission of gross production. |
|
|
|
|
|
|
|
|
|
|
|
|
|
|
|
|
|
|
|
|
|
|
|
|
|
|
|
|
|
|
|
|
|
|
|
|
|
|
|
|
|
|
|
|
|
|
|
|
| © OECD/IEA, 2007 |
|
|
|
|
|
|
|
|
|
|
|
|
|
|
|
INTERNATIONAL ENERGY AGENCY |
|
|
|
|
|
|
|
|
|
|
|
|
|
|
|
|
|
|
|
|
|
|
|
|
|
|
|
|
|
|
|
|
|
|
|
|
|
|
|
|
|
|
|
|
|
|
|
|
|
|
|
|
|
|
|
|
|
|
|
|
|
|
|
|
|
|
|
|
|
|
|
|
|
|
|
|
|
|
|
|
|
|
|
|
|
|
|
|
|
|
|
|
|
|
|
|
|
|
|
|
|
|
|
|
|
|
|
|
|
|
|
|
|
|
|
|
|
|
|
|
|
|
|
|
|
|
|
|
|
|
|
|
|
|
|
|
|
|
|
|
|
|
|
|
|
|
|
|
|
|
|
|
|
|
|
|
|
|
|
|
|
|
|
|
|
|
|
|
|
|
|
|
|
|
|
|
|
|
|
|
|
|
|
|
|
|
|
|
|
|
|
|
|
|
|
|
|
|
|
|
|
|
|
|
|
|
|
|
|
|
|
|
|
|
|
|
|
|
|
|
|
|
|
|
|
|
|
|
|
|
|
|
|
|
|
|
|
|
|
|
|
|
|
|
|
|
|
|
|
|
|
|
|
|
|
|
|
|
|
|
|
|
|
|
|
|
|
|
|
|
|
|
|
|
|
|
|
|
|
|
|
|
|
|
|
|
|
|
|
|
|
|
|
|
|
|
|
|
|
|
|
|
|
|
|
|
|
|
|
|
|
|
|
|
|
|
|
|
|
|
|
|
|
|
|
|
|
|
|
|
|
|
|
|
|
|
|
|
|
|
|
|
|
|
|
|
|
|
|
|
|
|
|
|
|
|
|
|
|
|
|
|
|
|
|
|
|
|
|
|
|
|
|
|
|
|
|
|
|
|
|
|
|
|
|
|
|
|
|
|
|
|
|
|
|
|
|
|
|
|
|
|
|
|
|
|
|
|
|
|
|
|
|
|
|
|
|
|
|
|
|
|
|
|
|
|
|
|
|
|
|
|
|
|