World Oil Facts
Reserves/Production/Consumption
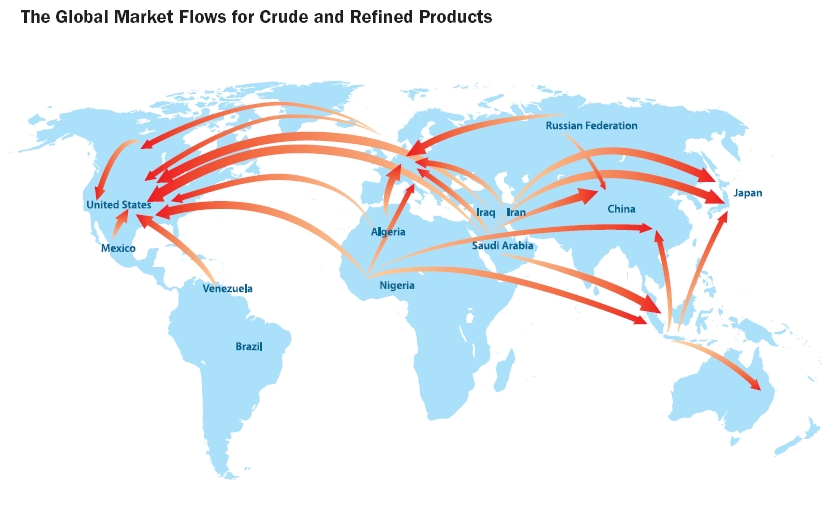
Oil Exporters / U.S. Oil Import Sources

|
Reserves
(millions of barrels as of January 1, 2002): Top 20
countries |
| Saudi Arabia | 261,750 |
| Iraq | 112,500 |
| United Arab Emirates | 97,800 |
| Kuwait | 96,500 |
| Iran | 89,700 |
| Venezuela | 77,685 |
| Russia | 48,573 |
| Libya | 29,500 |
| Mexico | 26,941 |
| Nigeria | 24,000 |
| China | 24,000 |
| United States | 22,045 |
| Qatar | 15,207 |
| Norway | 9,947 |
| Algeria | 9,200 |
| Brazil | 8,465 |
| Oman | 5,506 |
| Kazakhstan | 5,417 |
| Angola | 5,412 |
| Indonesia | 5,000 |
| First 20 Countries | 975,148 |
| Rest of the World | 56,983 |
| World | 1,032,132 |
| Production (millions of barrels/day): Top 20
Countries |
| Saudi Arabia | 8.528 |
| United States | 8.091 |
| Russia | 7.014 |
| Iran | 3.775 |
| Mexico | 3.560 |
| Norway | 3.408 |
| China | 3.297 |
| Venezuela | 3.137 |
| Canada | 2.749 |
| United Arab Emirates | 2.550 |
| United Kingdom | 2.540 |
| Iraq | 2.377 |
| Nigeria | 2.223 |
| Kuwait | 1.838 |
| Brazil | 1.589 |
| Algeria | 1.486 |
| Libya | 1.427 |
| Indonesia | 1.384 |
| Oman | 0.964 |
| Argentina | 0.825 |
| First 20 countries | 62.762 |
| Rest of the World | 12.464 |
| World | 75.226 |
| World Annual | 28,180 |
| Consumption (Millions of barrels/day): Top 20
Countries |
| United States | 19.993 |
| Japan | 5.423 |
| China | 4.854 |
| Germany | 2.814 |
| Russia | 2.531 |
| South Korea | 2.126 |
| Brazil | 2.123 |
| Canada | 2.048 |
| France | 2.040 |
| India | 2.011 |
| Mexico | 1.932 |
| Italy | 1.881 |
| United Kingdom | 1.699 |
| Spain | 1.465 |
| SaudiArabia | 1.415 |
| Iran | 1.109 |
| Indonesia | 1.063 |
| Netherlands | 0.881 |
| Australia | 0.879 |
| Taiwan | 0.846 |
| First 20 Countries | 59.134 |
| Rest of the World | 16.854 |
| World | 75.988 |
| World Annual | 28,460 |
Note: The estimation of reserves is fraught
with politics and guesswork. The two annual industry benchmarks are compiled by
World Oil and Oil and Cas Journal largely from data provided by individual
countries. Both outfits have placed "proven" global reserves at about 1 trillion
barrels for most of the last decade. In contrast, in 1995 PetroConsultants
estimated "assessed" reserves at 746 billion barrels.
It's suspected that many OPEC countries
pump-up their estimated reserves because their production quotas are based on
the size of the reserves. In 1988 and 1990, many Middle Eastern countries
revised their reserves upwards dramatically despite no major new discoveries.
From 1986 to 1990, according to data from World Oil and Oil and Gas Journal,
global reserves increased a staggering 39 percent from 708 billion barrels to
983 billion barrels.
Top World Oil Exporters
(millions of barrels per day) - 2001 |
Saudi Arabia: 7.38
Russia:
4.76
Norway: 3.22
Iran: 2.74
Venezuela: 2.60
United Arab
Emirates: 2.09
Nigeria: 2.00
Iraq: 2.00
Kuwait: 1.80
Mexico:
1.65
Libya: 1.24
Algeria: 1.24 |
Sources of U.S. Oil Imports (millions
of barrels per day) - 2001 |
Canada: 1.79
Saudi Arabia:
1.66
Venezuela: 1.54
Mexico: 1.42
Nigeria: .86
Iraq:
.78
Norway: .33
Angola: .32
United Kingdom: .31
Total:
11.62 |