| |
|
|
|
|
|
|
|
|
|
|
|
|
|
|
|
MONTHLY
ELECTRICITY STATISTICS, January 2010
- 1 |
|
|
|
|
|
|
|
|
| OECD Total |
|
|
|
|
|
|
|
|
|
|
|
|
|
|
|
|
|
|
|
|
TWh |
|
|
| |
janv-10 |
janv-09 |
The last 3 months |
Year-to-Date |
Past Year |
|
| |
|
|
% change |
|
oct-09 |
|
nov-09 |
|
déc-09 |
|
janv-10 |
|
% change |
|
2009 |
|
|
| |
|
|
|
|
|
|
|
|
|
|
|
| +
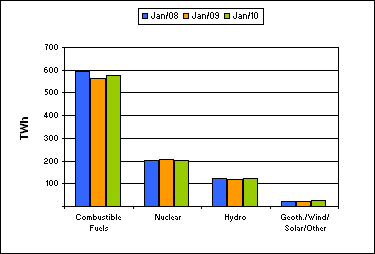
Combustible Fuels |
578.0 |
|
2.6% |
|
501.4 |
|
487.8 |
|
549.6 |
|
578.0 |
|
2.6% |
|
6 072 |
|
|
|
| + Nuclear |
200.9 |
|
-1.9% |
|
164.3 |
|
168.2 |
|
195.2 |
|
200.9 |
|
-1.9% |
|
2 128 |
|
|
|
| + Hydro |
125.2 |
|
3.5% |
|
102.6 |
|
103.8 |
|
122.1 |
|
125.2 |
|
3.5% |
|
1 350 |
|
|
|
| + Geoth./Wind/Solar/Other |
25.3 |
|
10.7% |
|
24.5 |
|
26.4 |
|
25.3 |
|
25.3 |
|
10.7% |
|
281 |
|
|
|
| = Indigenous Production |
929.4 |
|
1.9% |
|
792.8 |
|
786.1 |
|
892.2 |
|
929.4 |
|
1.9% |
|
9 830 |
|
|
|
| + Imports |
34.6 |
|
-0.8% |
|
32.4 |
|
31.7 |
|
34.7 |
|
34.6 |
|
-0.8% |
|
378 |
|
|
|
| - Exports |
31.8 |
|
-5.9% |
|
30.6 |
|
30.6 |
|
34.2 |
|
31.8 |
|
-5.9% |
|
362 |
|
|
|
| |
|
|
|
|
|
|
|
|
|
|
|
|
|
|
|
|
|
|
| |
|
|
|
|
|
|
|
|
|
|
|
|
|
|
|
|
|
|
| = Electricity Supplied |
932.3 |
|
2.1% |
|
794.6 |
|
787.2 |
|
892.7 |
|
932.3 |
|
2.1% |
|
9 845 |
|
|
|
| |
|
|
|
|
|
|
|
|
|
|
|
|
|
|
|
|
|
|
|
|
|
|
Period |
Date |
|
|
|
|
|
|
|
|
|
|
|
|
|
|
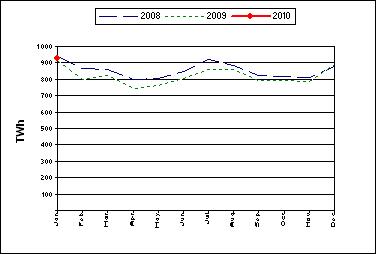
| - Electricity production was 929.4 TWh in
January 2010. |
|
|
| -
This was an increase of 37.2 TWh, or 4.2%, compared to the previous month. |
|
|
| -
Combustible Fuels production showed the most significant percentage change
compared to the previous month |
|
| with an increase of 5.2%, or
28.3 TWh. |
|
|
|
|
|
|
|
|
|
|
|
|
|
|
|
|
|
| -
Total production for the year-to-date was 929.4 TWh. Comparing this to the
same period last year shows that: |
|
| - Total
production was higher by 17.5 TWh, or 1.9%. |
|
|
| -
Geoth./Wind/Solar/Other production showed the largest percentage change by
fuel type, being 10.7% higher. |
|
| - Trade volume
decreased by 2.3 TWh, or 3.3%. |
|
|
|
|
|
|
|
|
|
|
|
|
|
|
|
| Electricity
Production Compared to Previous Year |
'Year to Date'
Comparison of Production by Fuel Type |
|
|
|
|
|
|
|
|
|
|
|
|
|
|
|
|
|
|
|
|
|
|
|
|
|
|
|
|
|
|
|
|
|
|
|
|
|
|
|
|
|
|
|
|
|
|
|
|
|
|
|
|
|
|
|
|
|
|
|
|
|
|
|
|
|
|
| COUNTRY NOTES: |
|
|
| -
OECD includes Australia, Austria, Belgium, Canada, the Czech Republic,
Denmark, Finland, France, Germany, Greece, |
|
| Hungary,
Iceland, Ireland, Italy, Japan, Korea, Luxembourg, Mexico, the Netherlands,
New Zealand, Portugal, Spain, |
|
| Sweden,
Norway, Poland, the Slovak Republic, Switzerland, Turkey, the United Kingdom
and the United States. |
|
|
|
|
|
|
|
|
|
|
|
|
|
|
|
|
|
|
|
|
|
|
|
|
|
|
|
|
|
|
|
|
|
|
| © OECD/IEA, 2010 |
|
|
|
|
|
|
|
|
|
|
|
|
|
|
|
INTERNATIONAL ENERGY AGENCY |
|
|
|
|
|
|
|
|
|
|
|
|
|
|
|
|
|
|
|
|
|
|
|
|
|
|
|
|
|
|
|
|
|
|
|
|
|
|
|
|
|
|
|
|
|
|
|
|
|
|
|
|
|
|
|
|
|
|
|
|
|
|