| |
|
|
|
|
|
|
|
|
|
|
|
|
|
|
|
MONTHLY
ELECTRICITY STATISTICS, January 2010
- 4 |
|
|
|
|
|
|
|
|
| OECD Pacific |
|
|
|
|
|
|
|
|
|
|
|
|
|
TWh |
|
|
| |
janv-10 |
janv-09 |
The last 3 months |
Year-to-Date |
Past Year |
|
| |
|
|
% change |
|
oct-09 |
|
nov-09 |
|
déc-09 |
|
janv-10 |
|
% change |
|
2009 |
|
|
| |
|
|
|
|
|
|
|
|
|
|
|
| +
Combustible Fuels |
106.4 |
|
3.8% |
|
87.8 |
|
93.0 |
|
100.4 |
|
106.4 |
|
3.8% |
|
1 120 |
|
|
|
| + Nuclear |
37.7 |
|
3.2% |
|
33.8 |
|
33.8 |
|
38.8 |
|
37.7 |
|
3.2% |
|
406 |
|
|
|
| + Hydro |
8.6 |
|
10.5% |
|
8.8 |
|
8.6 |
|
8.8 |
|
8.6 |
|
10.5% |
|
126 |
|
|
|
| + Geoth./Wind/Solar/Other |
1.5 |
|
4.7% |
|
1.5 |
|
1.5 |
|
1.5 |
|
1.5 |
|
4.7% |
|
18 |
|
|
|
| = Indigenous Production |
154.2 |
|
4.0% |
|
132.0 |
|
136.9 |
|
149.5 |
|
154.2 |
|
4.0% |
|
1 669 |
|
|
|
| + Imports |
0.0 |
|
0.0% |
|
0.0 |
|
0.0 |
|
0.0 |
|
0.0 |
|
0.0% |
|
0 |
|
|
|
| - Exports |
0.0 |
|
0.0% |
|
0.0 |
|
0.0 |
|
0.0 |
|
0.0 |
|
0.0% |
|
0 |
|
|
|
| |
|
|
|
|
|
|
|
|
|
|
|
|
|
|
|
|
|
|
| |
|
|
|
|
|
|
|
|
|
|
|
|
|
|
|
|
|
|
| = Electricity Supplied |
154.2 |
|
4.0% |
|
132.0 |
|
136.9 |
|
149.5 |
|
154.2 |
|
4.0% |
|
1 669 |
|
|
|
| |
|
|
|
|
|
|
|
|
|
|
|
|
|
|
|
|
|
|
|
|
|
|
Period |
Date |
|
|
|
|
|
|
|
|
|
|
|
|
|
|
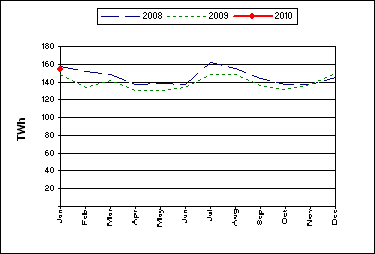
| - Electricity production was 154.2 TWh in
January 2010. |
|
|
| -
This was an increase of 4.7 TWh, or 3.1%, compared to the previous month. |
|
|
| -
Combustible Fuels production showed the most significant percentage change
compared to the previous month |
|
| with an increase of 6.1%, or
6.1 TWh. |
|
|
|
|
|
|
|
|
|
|
|
|
|
|
|
|
|
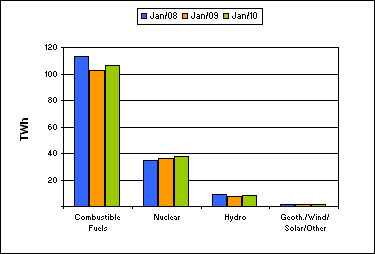
| -
Total production for the year-to-date was 154.2 TWh. Comparing this to the
same period last year shows that: |
|
| - Total production
was higher by 5.9 TWh, or 4%. |
|
|
| -
Hydro production showed the largest percentage change by fuel type, being
10.5% higher. |
|
|
|
|
|
|
|
|
|
|
|
|
|
|
|
|
|
| Electricity
Production Compared to Previous Year |
'Year to Date'
Comparison of Production by Fuel Type |
|
|
|
|
|
|
|
|
|
|
|
|
|
|
|
|
|
|
|
|
|
|
|
|
|
|
|
|
|
|
|
|
|
|
|
|
|
|
|
|
|
|
|
|
|
|
|
|
|
|
|
|
|
|
|
|
|
|
|
|
|
|
|
|
|
|
| COUNTRY NOTES: |
|
|
| -
OECD Pacific includes Australia, Japan, Korea and New Zealand. |
|
|
|
|
|
|
|
|
|
|
|
|
|
|
|
|
|
|
|
|
|
|
|
|
|
|
|
|
|
|
|
|
|
|
|
|
|
|
|
|
|
|
|
| © OECD/IEA, 2010 |
|
|
|
|
|
|
|
|
|
|
|
|
|
|
|
INTERNATIONAL ENERGY AGENCY |
|
|
|
|
|
|
|
|
|
|
|
|
|
|
|
|
|
|
|
|
|
|
|
|
|
|
|
|
|
|
|
|
|
|
|
|
|
|
|
|
|
|
|
|
|
|
|
|
|
|
|
|
|
|
|
|
|
|
|
|
|
|
|
|
|
|
|
|
|
|
|
|
|
|