| |
|
|
|
|
|
|
|
|
|
|
|
|
|
|
|
MONTHLY
ELECTRICITY STATISTICS, January 2010
- 14 |
|
|
|
|
|
|
|
|
| GERMANY |
|
|
|
|
|
|
|
|
|
|
|
|
|
GWh |
|
|
| |
janv-10 |
janv-09 |
The last 3 months |
Year-to-Date |
Past Year |
|
| |
|
|
% change |
|
oct-09 |
|
nov-09 |
|
déc-09 |
|
janv-10 |
|
% change |
|
2009 |
|
|
| |
|
|
|
|
|
|
|
|
|
|
|
| +
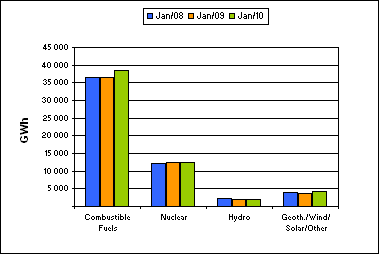
Combustible Fuels |
38 614 |
|
5.6% |
|
33 426 |
|
32 843 |
|
34 252 |
|
38 614 |
|
5.6% |
|
364 869 |
|
64.6% |
|
| + Nuclear |
12 511 |
|
-0.6% |
|
10 086 |
|
11 368 |
|
12 301 |
|
12 511 |
|
-0.6% |
|
127 433 |
|
22.6% |
|
| + Hydro |
1 996 |
|
8.1% |
|
1 574 |
|
1 763 |
|
2 057 |
|
1 996 |
|
8.1% |
|
24 999 |
|
4.4% |
|
| + Geoth./Wind/Solar/Other |
4 160 |
|
13.2% |
|
4 090 |
|
4 120 |
|
4 150 |
|
4 160 |
|
13.2% |
|
47 325 |
|
8.4% |
|
| = Indigenous Production |
57 281 |
|
4.8% |
|
49 176 |
|
50 094 |
|
52 760 |
|
57 281 |
|
4.8% |
|
564 626 |
|
100.0% |
|
| + Imports |
2 750 |
|
-26.7% |
|
3 368 |
|
2 632 |
|
2 911 |
|
2 750 |
|
-26.7% |
|
41 977 |
|
|
|
| - Exports |
6 042 |
|
-0.8% |
|
4 751 |
|
5 786 |
|
6 140 |
|
6 042 |
|
-0.8% |
|
53 963 |
|
|
|
| |
|
|
|
|
|
|
|
|
|
|
|
|
|
|
|
|
|
|
| |
|
|
|
|
|
|
|
|
|
|
|
|
|
|
|
|
|
|
| = Electricity Supplied |
53 989 |
|
3.1% |
|
47 793 |
|
46 940 |
|
49 531 |
|
53 989 |
|
3.1% |
|
552 640 |
|
|
|
| |
|
|
|
|
|
|
|
|
|
|
|
|
|
|
|
|
|
|
|
|
|
|
Period |
Date |
|
|
|
|
|
|
|
|
|
|
|
|
|
|
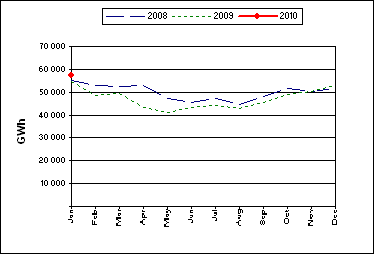
| - Electricity production was 57 281 GWh in
January 2010. |
|
|
| -
This was an increase of 4 521 GWh, or 8.6%, compared to the previous month. |
|
| -
Combustible Fuels production showed the most significant percentage change
compared to the previous month |
|
| with an increase of 12.7%,
or 4 362 GWh. |
|
|
|
|
|
|
|
|
|
|
|
|
|
|
|
|
|
| -
Total production for the year-to-date was 57 281 GWh. Comparing this to the
same period last year shows that: |
|
| - Total
production was higher by 2 602 GWh, or 4.8%. |
|
|
| -
Geoth./Wind/Solar/Other production showed the largest percentage change by
fuel type, being 13.2% higher. |
|
| - Trade volume
decreased by 1 049 GWh, or 10.7%. |
|
|
|
|
|
|
|
|
|
|
|
|
|
| Electricity
Production Compared to Previous Year |
'Year to Date'
Comparison of Production by Fuel Type |
|
|
|
|
|
|
|
|
|
|
|
|
|
|
|
|
|
|
|
|
|
|
|
|
|
|
|
|
|
|
|
|
|
|
|
|
|
|
|
|
|
|
|
|
|
|
|
|
|
|
|
|
|
|
|
|
|
|
|
|
|
|
|
|
|
|
| COUNTRY NOTES: |
|
|
| -
Net production is estimated from monthly submission of gross production. |
|
|
| -
Geoth./Wind/Solar/Other production is estimated by the IEA Secretariat. |
|
|
|
|
|
|
|
|
|
|
|
|
|
|
|
|
|
|
|
|
|
|
|
|
|
|
|
|
|
|
|
|
|
|
|
|
|
|
|
|
| © OECD/IEA, 2010 |
|
|
|
|
|
|
|
|
|
|
|
|
|
|
|
INTERNATIONAL ENERGY AGENCY |
|
|
|
|
|
|
|
|
|
|
|
|
|
|
|
|
|
|
|
|
|
|
|
|
|
|
|
|
|
|
|
|
|
|
|
|
|
|
|
|
|
|
|
|
|
|
|
|
|
|
|
|
|
|
|
|
|
|
|
|
|
|
|
|
|
|
|
|
|
|
|
|
|
|