| |
|
|
|
|
|
|
|
|
|
|
|
|
|
|
|
MONTHLY
ELECTRICITY STATISTICS, January 2010
- 32 |
|
|
|
|
|
|
|
|
| SWITZERLAND |
|
|
|
|
|
|
|
|
|
|
|
|
|
GWh |
|
|
| |
janv-10 |
janv-09 |
The last 3 months |
Year-to-Date |
Past Year |
|
| |
|
|
% change |
|
oct-09 |
|
nov-09 |
|
déc-09 |
|
janv-10 |
|
% change |
|
2009 |
|
|
| |
|
|
|
|
|
|
|
|
|
|
|
| +
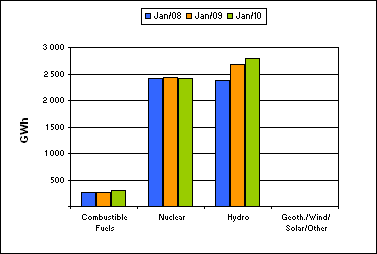
Combustible Fuels |
296 |
|
10.0% |
|
257 |
|
270 |
|
276 |
|
296 |
|
10.0% |
|
3 067 |
|
|
|
| + Nuclear |
2 423 |
|
-0.1% |
|
2 403 |
|
2 320 |
|
2 422 |
|
2 423 |
|
-0.1% |
|
26 119 |
|
|
|
| + Hydro |
2 800 |
|
4.7% |
|
2 356 |
|
1 976 |
|
2 302 |
|
2 800 |
|
4.7% |
|
37 137 |
|
|
|
| + Geoth./Wind/Solar/Other |
6 |
|
100.0% |
|
3 |
|
3 |
|
3 |
|
6 |
|
100.0% |
|
36 |
|
|
|
| = Indigenous Production |
5 525 |
|
2.8% |
|
5 019 |
|
4 569 |
|
5 003 |
|
5 525 |
|
2.8% |
|
66 359 |
|
|
|
| + Imports |
3 340 |
|
11.3% |
|
3 132 |
|
3 069 |
|
3 340 |
|
3 340 |
|
11.3% |
|
32 688 |
|
|
|
| - Exports |
2 668 |
|
10.5% |
|
2 937 |
|
2 473 |
|
2 668 |
|
2 668 |
|
10.5% |
|
34 488 |
|
|
|
| |
|
|
|
|
|
|
|
|
|
|
|
|
|
|
|
|
|
|
| |
|
|
|
|
|
|
|
|
|
|
|
|
|
|
|
|
|
|
| = Electricity Supplied |
6 197 |
|
4.0% |
|
5 214 |
|
5 165 |
|
5 675 |
|
6 197 |
|
4.0% |
|
64 559 |
|
|
|
| |
|
|
|
|
|
|
|
|
|
|
|
|
|
|
|
|
|
|
|
|
|
|
Period |
Date |
|
|
|
|
|
|
|
|
|
|
|
|
|
|
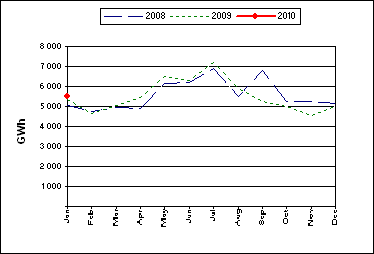
| - Electricity production was 5 525 GWh in
January 2010. |
|
|
| -
This was an increase of 522 GWh, or 10.4%, compared to the previous month. |
|
| -
Geoth./Wind/Solar/Other production showed the most significant percentage
change compared to the previous month |
|
| with an increase of 100%, or 3
GWh. |
|
|
|
|
|
|
|
|
|
|
|
|
|
|
|
|
|
| -
Total production for the year-to-date was 5 525 GWh. Comparing this to the
same period last year shows that: |
|
| - Total
production was higher by 152 GWh, or 2.8%. |
|
|
| -
Geoth./Wind/Solar/Other production showed the largest percentage change by
fuel type, being 100% higher. |
|
| - Trade volume
increased by 594 GWh, or 11%. |
|
|
|
|
|
|
|
|
|
|
|
|
|
| Electricity
Production Compared to Previous Year |
'Year to Date'
Comparison of Production by Fuel Type |
|
|
|
|
|
|
|
|
|
|
|
|
|
|
|
|
|
|
|
|
|
|
|
|
|
|
|
|
|
|
|
|
|
|
|
|
|
|
|
|
|
|
|
|
|
|
|
|
|
|
|
|
|
|
|
|
|
|
|
|
|
|
|
|
|
|
| COUNTRY NOTES: |
|
|
| -
Does not include Liechtenstein. |
|
|
| -
Geoth./Wind/Solar/Other production is estimated by the IEA Secretariat. |
|
|
| -
The production data for January 2010 are provisional data. |
|
|
| -
The trade data for January 2010 are estimated by the IEA Secretariat. |
|
|
|
|
|
|
|
|
|
|
|
|
|
|
|
|
|
|
|
|
|
|
|
|
|
|
|
|
|
|
|
|
|
| © OECD/IEA, 2010 |
|
|
|
|
|
|
|
|
|
|
|
|
|
|
|
INTERNATIONAL ENERGY AGENCY |
|
|
|
|
|
|
|
|
|
|
|
|
|
|
|
|
|
|
|
|
|
|
|
|
|
|
|
|
|
|
|
|
|
|
|
|
|
|
|
|
|
|
|
|
|
|
|
|
|
|
|
|
|
|
|
|
|
|
|
|
|
|
|
|
|
|
|
|
|
|
|
|
|
|