| |
|
|
|
|
|
|
|
|
|
|
|
|
|
|
|
MONTHLY
ELECTRICITY STATISTICS, January 2008
- 5 |
|
|
|
|
|
|
|
|
|
|
|
|
|
|
|
|
|
|
|
|
|
|
|
|
|
|
|
|
|
|
|
|
|
|
|
|
|
|
|
|
|
|
|
|
|
|
|
|
|
|
|
|
|
|
|
|
|
|
|
|
|
|
|
|
|
|
|
|
|
|
|
|
|
|
|
|
|
|
|
|
|
|
|
|
|
|
|
|
|
|
|
|
|
|
|
|
|
|
|
|
|
|
|
|
|
|
|
|
|
|
| IEA Total |
|
|
|
|
|
|
|
|
|
|
|
|
|
|
|
TWh |
|
|
|
| |
Jan/08 |
Jan/07 |
The last 3 months |
Year-to-Date |
Past Year |
|
|
| |
|
|
% change |
|
Oct/07 |
|
Nov/07 |
|
Dec/07 |
|
Jan/08 |
|
% change |
|
2007 |
|
|
|
| |
|
|
|
|
|
|
|
|
|
|
|
|
| +
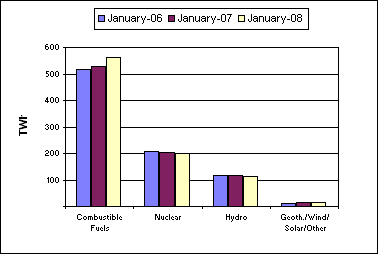
Combustible Fuels |
563.6 |
|
6.7% |
|
521.2 |
|
514.8 |
|
552.8 |
|
563.6 |
|
6.7% |
|
6 212 |
|
|
|
|
| + Nuclear |
201.7 |
|
-0.2% |
|
174.1 |
|
175.6 |
|
192.7 |
|
201.7 |
|
-0.2% |
|
2 161 |
|
|
|
|
| + Hydro |
114.6 |
|
-2.9% |
|
90.8 |
|
95.7 |
|
103.6 |
|
114.6 |
|
-2.9% |
|
1 262 |
|
|
|
|
| + Geoth./Wind/Solar/Other |
16.2 |
|
10.0% |
|
14.6 |
|
15.1 |
|
15.4 |
|
16.2 |
|
10.0% |
|
171 |
|
|
|
|
| = Indigenous Production |
896.0 |
|
3.8% |
|
800.7 |
|
801.2 |
|
864.6 |
|
896.0 |
|
3.8% |
|
9 806 |
|
|
|
|
| + Imports |
33.5 |
|
7.2% |
|
30.8 |
|
32.2 |
|
32.9 |
|
33.5 |
|
7.2% |
|
386 |
|
|
|
|
| - Exports |
33.9 |
|
7.2% |
|
30.2 |
|
30.2 |
|
31.3 |
|
33.9 |
|
7.2% |
|
380 |
|
|
|
|
| |
|
|
|
|
|
|
|
|
|
|
|
|
|
|
|
|
|
|
|
| |
|
|
|
|
|
|
|
|
|
|
|
|
|
|
|
|
|
|
|
| = Electricity Supplied |
895.6 |
|
3.8% |
|
801.2 |
|
803.3 |
|
866.2 |
|
895.6 |
|
3.8% |
|
9 812 |
|
|
|
|
| |
|
|
|
|
|
|
|
|
|
|
|
|
|
|
|
|
|
|
| |
|
|
|
|
|
|
|
|
Period |
Date |
|
|
|
|
|
|
|
|
|
|
|
|
|
|
|
|
|
|
|
|
|
|
|
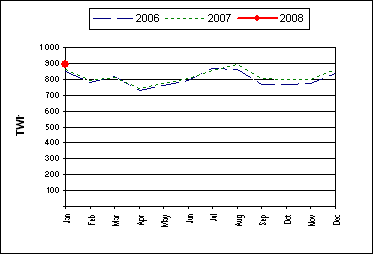
| - Electricity production was 896.0 TWh in
January 2008. |
|
|
|
| -
This was higher by 33.2 TWh, or 3.8 %, compared to January 2007. |
|
|
|
| -
This was an increase of 31.4 TWh, or 3.6 %, compared to the previous month. |
|
|
|
| -
Hydro production showed the most significant percentage change compared to
the previous month with |
|
|
| an increase of 10.5 %, or 10.9
TWh. |
|
|
|
|
|
|
|
|
|
|
|
|
|
|
|
| -
Total production for the year-to-date was 896.0 TWh. Comparing this to the
same period last year shows that: |
|
|
| - Total
production was higher by 33.2 TWh, or 3.8 %. |
|
|
|
| -
Geoth./Wind/Solar/Other production showed the largest percentage change by
fuel type, being 10 % higher. |
|
|
| - Trade volume
increased by 4.5 TWh, or 7.2 %. |
|
|
|
|
|
|
|
|
|
|
|
|
|
|
|
|
|
| Electricity
Production Compared to Previous Year |
'Year to Date'
Comparison of Production by Fuel Type |
|
|
|
|
|
|
|
|
|
|
|
|
|
|
|
|
|
|
|
|
|
|
|
|
|
|
|
|
|
|
|
|
|
|
|
|
|
|
|
|
|
|
|
|
|
|
|
|
|
|
|
|
|
|
|
|
|
|
|
|
|
|
|
|
|
|
|
|
|
|
|
|
|
|
|
|
|
|
|
|
| COUNTRY NOTES: |
|
|
|
|
|
|
|
| IEA
includes all OECD countries except Iceland, Mexico and Poland. |
|
|
|
|
|
|
|
|
|
|
|
|
|
|
|
|
|
|
|
|
|
|
|
|
|
|
|
|
|
|
|
|
|
|
|
|
|
|
|
|
|
|
|
|
|
|
|
|
| © OECD/IEA, 2008 |
|
|
|
|
|
|
|
|
|
|
|
|
|
|
|
INTERNATIONAL ENERGY AGENCY |
|
|
|
|
|
|
|
|
|
|
|
|
|
|
|
|
|
|
|
|
|
|
|
|
|
|
|
|
|
|
|
|
|
|
|
|
|
|
|
|
|
|
|
|
|
|
|
|
|
|
|
|
|
|
|
|
|
|
|
|
|
|
|
|
|
|
|
|
|
|
|
|
|
|
|
|
|
|
|
|
|
|
|
|
|
|
|
|
|
|
|
|
|
|
|
|
|
|
|
|
|
|
|
|
|
|
|
|
|
|
|
|
|
|
|
|
|
|
|
|
|
|
|
|
|
|
|
|
|
|
|
|
|
|
|
|
|
|
|
|
|
|
|
|
|
|
|
|
|
|
|
|
|
|
|
|
|
|
|
|
|
|
|
|
|
|
|
|
|
|
|
|
|
|
|
|
|
|
|
|
|
|
|
|
|
|
|
|
|
|
|
|
|
|
|
|
|
|
|
|
|
|
|
|
|
|
|
|
|
|
|
|
|
|
|
|
|
|
|
|
|
|
|
|
|
|
|
|
|
|
|
|
|
|
|
|
|
|
|
|
|
|
|
|
|
|
|
|
|
|
|
|
|
|
|
|
|
|
|
|
|
|
|
|
|
|
|
|
|
|
|
|
|
|
|
|
|
|
|
|
|
|
|
|
|
|
|
|
|
|
|
|
|
|
|
|
|
|
|
|
|
|
|
|
|
|
|
|
|
|
|
|
|
|
|
|
|
|
|
|
|
|
|
|
|
|
|
|
|
|
|
|
|
|
|
|
|
|
|
|
|
|
|
|
|
|
|
|
|
|
|
|
|
|
|
|
|
|
|
|
|
|
|
|
|
|
|
|
|
|
|
|
|
|
|
|
|
|
|
|
|
|
|
|
|
|
|
|
|
|
|
|
|
|
|
|
|
|
|
|
|
|
|
|
|
|
|
|
|
|
|
|
|
|
|
|
|
|
|
|
|
|
|
|
|
|
|
|
|
|
|
|
|
|