| |
|
|
|
|
|
|
|
|
|
|
|
|
|
|
|
MONTHLY
ELECTRICITY STATISTICS, January 2008
- 7 |
|
|
|
|
|
|
|
|
|
|
|
|
|
|
|
|
|
|
|
|
|
|
|
|
|
|
|
|
|
|
|
|
|
|
|
|
|
|
|
|
|
|
|
|
|
|
|
|
|
|
|
|
|
|
|
|
|
|
|
|
|
|
|
|
|
|
|
|
|
|
|
|
|
|
|
|
|
|
|
|
|
|
|
|
|
|
|
|
|
|
|
|
|
|
|
|
|
|
|
|
|
|
|
|
|
|
|
|
|
|
| AUSTRIA |
|
|
|
|
|
|
|
|
|
|
|
|
|
|
|
GWh |
|
|
|
| |
Jan/08 |
Jan/07 |
The last 3 months |
Year-to-Date |
Past Year |
|
|
| |
|
|
% change |
|
Oct/07 |
|
Nov/07 |
|
Dec/07 |
|
Jan/08 |
|
% change |
|
2007 |
|
|
|
| |
|
|
|
|
|
|
|
|
|
|
|
|
| +
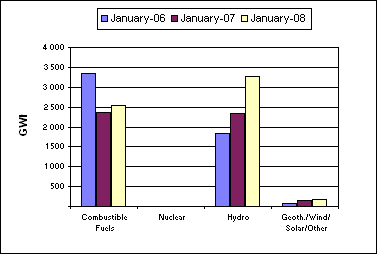
Combustible Fuels |
2 543 |
|
7.8% |
|
2 770 |
|
2 823 |
|
2 807 |
|
2 543 |
|
7.8% |
|
23 329 |
|
|
|
|
| + Nuclear |
0 |
|
0.0% |
|
0 |
|
0 |
|
0 |
|
0 |
|
0.0% |
|
0 |
|
|
|
|
| + Hydro |
3 274 |
|
40.3% |
|
2 838 |
|
2 614 |
|
2 526 |
|
3 274 |
|
40.3% |
|
34 413 |
|
|
|
|
| + Geoth./Wind/Solar/Other |
184 |
|
12.9% |
|
158 |
|
222 |
|
148 |
|
184 |
|
12.9% |
|
1 990 |
|
|
|
|
| = Indigenous Production |
6 001 |
|
23.6% |
|
5 766 |
|
5 659 |
|
5 481 |
|
6 001 |
|
23.6% |
|
59 732 |
|
|
|
|
| + Imports |
2 339 |
|
-13.9% |
|
1 560 |
|
1 801 |
|
2 339 |
|
2 339 |
|
-13.9% |
|
22 130 |
|
|
|
|
| - Exports |
1 440 |
|
1.6% |
|
1 438 |
|
1 534 |
|
1 440 |
|
1 440 |
|
1.6% |
|
15 512 |
|
|
|
|
| |
|
|
|
|
|
|
|
|
|
|
|
|
|
|
|
|
|
|
|
| |
|
|
|
|
|
|
|
|
|
|
|
|
|
|
|
|
|
|
|
| = Electricity Supplied |
6 900 |
|
12.1% |
|
5 888 |
|
5 926 |
|
6 380 |
|
6 900 |
|
12.1% |
|
66 350 |
|
|
|
|
| |
|
|
|
|
|
|
|
|
|
|
|
|
|
|
|
|
|
|
| |
|
|
|
|
|
|
|
|
Period |
Date |
|
|
|
|
|
|
|
|
|
|
|
|
|
|
|
|
|
|
|
|
|
|
|
| - Electricity production was 6 001 GWh in
January 2008. |
|
|
|
| -
This was higher by 1 145 GWh, or 23.6 %, compared to January 2007. |
|
|
|
| -
This was an increase of 520 GWh, or 9.5 %, compared to the previous month. |
|
|
|
| -
Hydro production showed the most significant percentage change compared to
the previous month with |
|
|
| an increase of 29.6 %, or 748
GWh. |
|
|
|
|
|
|
|
|
|
|
|
|
|
|
|
| -
Total production for the year-to-date was 6 001 GWh. Comparing this to the
same period last year shows that: |
|
|
| - Total
production was higher by 1 145 GWh, or 23.6 %. |
|
|
|
| -
Hydro production showed the largest percentage change by fuel type, being
40.3 % higher. |
|
|
| - Trade volume
decreased by 355 GWh, or 8.6 %. |
|
|
|
|
|
|
|
|
|
|
|
|
|
|
|
|
|
| Electricity
Production Compared to Previous Year |
'Year to Date'
Comparison of Production by Fuel Type |
|
|
|
|
|
|
|
|
|
|
|
|
|
|
|
|
|
|
|
|
|
|
|
|
|
|
|
|
|
|
|
|
|
|
|
|
|
|
|
|
|
|
|
|
|
|
|
|
|
|
|
|
|
|
|
|
|
|
|
|
|
|
|
|
|
|
|
|
|
|
|
|
|
|
|
|
|
|
|
|
| COUNTRY NOTES: |
|
|
|
| Monthly
submission of indigenous production is broken down by sources by the IEA
Secretariat. |
|
|
|
|
|
|
| Production
and trade data are estimated for January 2008. |
|
|
|
|
|
|
|
|
|
|
|
|
|
|
|
|
|
|
|
|
|
|
|
|
|
|
|
|
|
|
|
|
|
|
|
|
|
|
|
|
|
|
|
|
| © OECD/IEA, 2008 |
|
|
|
|
|
|
|
|
|
|
|
|
|
|
|
INTERNATIONAL ENERGY AGENCY |
|
|
|
|
|
|
|
|
|
|
|
|
|
|
|
|
|
|
|
|
|
|
|
|
|
|
|
|
|
|
|
|
|
|
|
|
|
|
|
|
|
|
|
|
|
|
|
|
|
|
|
|
|
|
|
|
|
|
|
|
|
|
|
|
|
|
|
|
|
|
|
|
|
|
|
|
|
|
|
|
|
|
|
|
|
|
|
|
|
|
|
|
|
|
|
|
|
|
|
|
|
|
|
|
|
|
|
|
|
|
|
|
|
|
|
|
|
|
|
|
|
|
|
|
|
|
|
|
|
|
|
|
|
|
|
|
|
|
|
|
|
|
|
|
|
|
|
|
|
|
|
|
|
|
|
|
|
|
|
|
|
|
|
|
|
|
|
|
|
|
|
|
|
|
|
|
|
|
|
|
|
|
|
|
|
|
|
|
|
|
|
|
|
|
|
|
|
|
|
|
|
|
|
|
|
|
|
|
|
|
|
|
|
|
|
|
|
|
|
|
|
|
|
|
|
|
|
|
|
|
|
|
|
|
|
|
|
|
|
|
|
|
|
|
|
|
|
|
|
|
|
|
|
|
|
|
|
|
|
|
|
|
|
|
|
|
|
|
|
|
|
|
|
|
|
|
|
|
|
|
|
|
|
|
|
|
|
|
|
|
|
|
|
|
|
|
|
|
|
|
|
|
|
|
|
|
|
|
|
|
|
|
|
|
|
|
|
|
|
|
|
|
|
|
|
|
|
|
|
|
|
|
|
|
|
|
|
|
|
|
|
|
|
|
|
|
|
|
|
|
|
|
|
|
|
|
|
|
|
|
|
|
|
|
|
|
|
|
|
|
|
|
|
|
|
|
|
|
|
|
|
|
|
|
|
|
|
|
|
|
|
|
|
|
|
|
|
|
|
|
|
|
|
|
|
|
|
|
|
|
|
|
|
|
|
|
|
|
|
|
|
|
|
|
|
|
|
|
|
|
|
|
|
|