| |
|
|
|
|
|
|
|
|
|
|
|
|
|
|
|
MONTHLY
ELECTRICITY STATISTICS, January 2008
- 11 |
|
|
|
|
|
|
|
|
|
|
|
|
|
|
|
|
|
|
|
|
|
|
|
|
|
|
|
|
|
|
|
|
|
|
|
|
|
|
|
|
|
|
|
|
|
|
|
|
|
|
|
|
|
|
|
|
|
|
|
|
|
|
|
|
|
|
|
|
|
|
|
|
|
|
|
|
|
|
|
|
|
|
|
|
|
|
|
|
|
|
|
|
|
|
|
|
|
|
|
|
|
|
|
|
|
|
|
|
|
|
| DENMARK |
|
|
|
|
|
|
|
|
|
|
|
|
|
|
|
GWh |
|
|
|
| |
Jan/08 |
Jan/07 |
The last 3 months |
Year-to-Date |
Past Year |
|
|
| |
|
|
% change |
|
Oct/07 |
|
Nov/07 |
|
Dec/07 |
|
Jan/08 |
|
% change |
|
2007 |
|
|
|
| |
|
|
|
|
|
|
|
|
|
|
|
|
| +
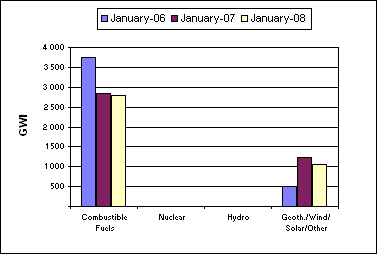
Combustible Fuels |
2 797 |
|
-1.6% |
|
2 957 |
|
3 447 |
|
3 302 |
|
2 797 |
|
-1.6% |
|
30 075 |
|
|
|
|
| + Nuclear |
0 |
|
0.0% |
|
0 |
|
0 |
|
0 |
|
0 |
|
0.0% |
|
0 |
|
|
|
|
| + Hydro |
4 |
|
-20.0% |
|
2 |
|
2 |
|
3 |
|
4 |
|
-20.0% |
|
30 |
|
|
|
|
| + Geoth./Wind/Solar/Other |
1 050 |
|
-14.4% |
|
307 |
|
711 |
|
592 |
|
1 050 |
|
-14.4% |
|
7 171 |
|
|
|
|
| = Indigenous Production |
3 851 |
|
-5.5% |
|
3 266 |
|
4 160 |
|
3 897 |
|
3 851 |
|
-5.5% |
|
37 276 |
|
|
|
|
| + Imports |
752 |
|
89.9% |
|
820 |
|
415 |
|
507 |
|
752 |
|
89.9% |
|
10 427 |
|
|
|
|
| - Exports |
1 185 |
|
14.7% |
|
924 |
|
1 280 |
|
1 047 |
|
1 185 |
|
14.7% |
|
11 377 |
|
|
|
|
| |
|
|
|
|
|
|
|
|
|
|
|
|
|
|
|
|
|
|
|
| |
|
|
|
|
|
|
|
|
|
|
|
|
|
|
|
|
|
|
|
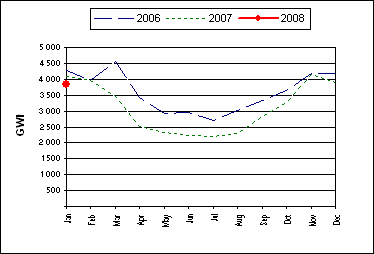
| = Electricity Supplied |
3 418 |
|
-0.5% |
|
3 162 |
|
3 295 |
|
3 357 |
|
3 418 |
|
-0.5% |
|
36 326 |
|
|
|
|
| |
|
|
|
|
|
|
|
|
|
|
|
|
|
|
|
|
|
|
| |
|
|
|
|
|
|
|
|
Period |
Date |
|
|
|
|
|
|
|
|
|
|
|
|
|
|
|
|
|
|
|
|
|
|
|
| - Electricity production was 3 851 GWh in
January 2008. |
|
|
|
| -
This was lower by 222 GWh, or 5.5 %, compared to January 2007. |
|
|
|
| -
This was a decrease of 46 GWh, or 1.2 %, compared to the previous month. |
|
|
|
| -
Geoth./Wind/Solar/Other production showed the most significant percentage
change compared to the previous month with |
|
|
| an increase of 77.4 %, or 458
GWh. |
|
|
|
|
|
|
|
|
|
|
|
|
|
|
|
| -
Total production for the year-to-date was 3 851 GWh. Comparing this to the
same period last year shows that: |
|
|
| - Total
production was lower by 222 GWh, or 5.5 %. |
|
|
|
| -
Hydro production showed the largest percentage change by fuel type, being 20
% lower. |
|
|
| - Trade volume
increased by 508 GWh, or 35.5 %. |
|
|
|
|
|
|
|
|
|
|
|
|
|
|
|
|
|
| Electricity
Production Compared to Previous Year |
'Year to Date'
Comparison of Production by Fuel Type |
|
|
|
|
|
|
|
|
|
|
|
|
|
|
|
|
|
|
|
|
|
|
|
|
|
|
|
|
|
|
|
|
|
|
|
|
|
|
|
|
|
|
|
|
|
|
|
|
|
|
|
|
|
|
|
|
|
|
|
|
|
|
|
|
|
|
|
|
|
|
|
|
|
|
|
|
|
|
|
|
| COUNTRY NOTES: |
|
|
|
|
|
|
|
| Does
not include Greenland and the Faroe Islands. |
|
|
|
|
|
|
|
|
|
|
|
|
|
|
|
|
|
|
|
|
|
|
|
|
|
|
|
|
|
|
|
|
|
|
|
|
|
|
|
|
|
|
|
|
|
|
|
|
| © OECD/IEA, 2008 |
|
|
|
|
|
|
|
|
|
|
|
|
|
|
|
INTERNATIONAL ENERGY AGENCY |
|
|
|
|
|
|
|
|
|
|
|
|
|
|
|
|
|
|
|
|
|
|
|
|
|
|
|
|
|
|
|
|
|
|
|
|
|
|
|
|
|
|
|
|
|
|
|
|
|
|
|
|
|
|
|
|
|
|
|
|
|
|
|
|
|
|
|
|
|
|
|
|
|
|
|
|
|
|
|
|
|
|
|
|
|
|
|
|
|
|
|
|
|
|
|
|
|
|
|
|
|
|
|
|
|
|
|
|
|
|
|
|
|
|
|
|
|
|
|
|
|
|
|
|
|
|
|
|
|
|
|
|
|
|
|
|
|
|
|
|
|
|
|
|
|
|
|
|
|
|
|
|
|
|
|
|
|
|
|
|
|
|
|
|
|
|
|
|
|
|
|
|
|
|
|
|
|
|
|
|
|
|
|
|
|
|
|
|
|
|
|
|
|
|
|
|
|
|
|
|
|
|
|
|
|
|
|
|
|
|
|
|
|
|
|
|
|
|
|
|
|
|
|
|
|
|
|
|
|
|
|
|
|
|
|
|
|
|
|
|
|
|
|
|
|
|
|
|
|
|
|
|
|
|
|
|
|
|
|
|
|
|
|
|
|
|
|
|
|
|
|
|
|
|
|
|
|
|
|
|
|
|
|
|
|
|
|
|
|
|
|
|
|
|
|
|
|
|
|
|
|
|
|
|
|
|
|
|
|
|
|
|
|
|
|
|
|
|
|
|
|
|
|
|
|
|
|
|
|
|
|
|
|
|
|
|
|
|
|
|
|
|
|
|
|
|
|
|
|
|
|
|
|
|
|
|
|
|
|
|
|
|
|
|
|
|
|
|
|
|
|
|
|
|
|
|
|
|
|
|
|
|
|
|
|
|
|
|
|
|
|
|
|
|
|
|
|
|
|
|
|
|
|
|
|
|
|
|
|
|
|
|
|
|
|
|
|
|
|
|
|
|
|
|
|
|
|
|
|
|
|
|
|
|