| |
|
|
|
|
|
|
|
|
|
|
|
|
|
|
|
MONTHLY
ELECTRICITY STATISTICS, January 2008
- 26 |
|
|
|
|
|
|
|
|
|
|
|
|
|
|
|
|
|
|
|
|
|
|
|
|
|
|
|
|
|
|
|
|
|
|
|
|
|
|
|
|
|
|
|
|
|
|
|
|
|
|
|
|
|
|
|
|
|
|
|
|
|
|
|
|
|
|
|
|
|
|
|
|
|
|
|
|
|
|
|
|
|
|
|
|
|
|
|
|
|
|
|
|
|
|
|
|
|
|
|
|
|
|
|
|
|
|
|
|
|
|
| NORWAY |
|
|
|
|
|
|
|
|
|
|
|
|
|
|
|
GWh |
|
|
|
| |
Jan/08 |
Jan/07 |
The last 3 months |
Year-to-Date |
Past Year |
|
|
| |
|
|
% change |
|
Oct/07 |
|
Nov/07 |
|
Dec/07 |
|
Jan/08 |
|
% change |
|
2007 |
|
|
|
| |
|
|
|
|
|
|
|
|
|
|
|
|
| +
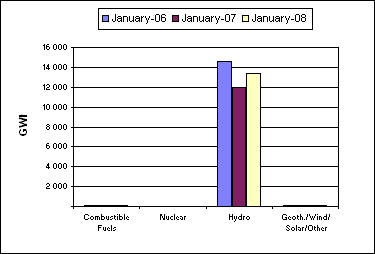
Combustible Fuels |
105 |
|
22.1% |
|
122 |
|
142 |
|
183 |
|
105 |
|
22.1% |
|
1 234 |
|
|
|
|
| + Nuclear |
0 |
|
0.0% |
|
0 |
|
0 |
|
0 |
|
0 |
|
0.0% |
|
0 |
|
|
|
|
| + Hydro |
13 352 |
|
11.1% |
|
11 379 |
|
12 002 |
|
12 543 |
|
13 352 |
|
11.1% |
|
134 003 |
|
|
|
|
| + Geoth./Wind/Solar/Other |
94 |
|
0.0% |
|
90 |
|
95 |
|
94 |
|
94 |
|
0.0% |
|
900 |
|
|
|
|
| = Indigenous Production |
13 551 |
|
11.1% |
|
11 591 |
|
12 239 |
|
12 820 |
|
13 551 |
|
11.1% |
|
136 137 |
|
|
|
|
| + Imports |
487 |
|
-53.5% |
|
250 |
|
448 |
|
813 |
|
487 |
|
-53.5% |
|
5 276 |
|
|
|
|
| - Exports |
968 |
|
36.5% |
|
1 257 |
|
713 |
|
624 |
|
968 |
|
36.5% |
|
15 321 |
|
|
|
|
| |
|
|
|
|
|
|
|
|
|
|
|
|
|
|
|
|
|
|
|
| |
|
|
|
|
|
|
|
|
|
|
|
|
|
|
|
|
|
|
|
| = Electricity Supplied |
13 070 |
|
4.3% |
|
10 584 |
|
11 974 |
|
13 009 |
|
13 070 |
|
4.3% |
|
126 092 |
|
|
|
|
| |
|
|
|
|
|
|
|
|
|
|
|
|
|
|
|
|
|
|
| |
|
|
|
|
|
|
|
|
Period |
Date |
|
|
|
|
|
|
|
|
|
|
|
|
|
|
|
|
|
|
|
|
|
|
|
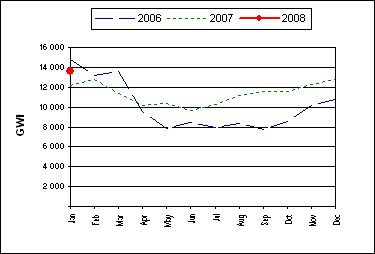
| - Electricity production was 13 551 GWh in
January 2008. |
|
|
|
| -
This was higher by 1 354 GWh, or 11.1 %, compared to January 2007. |
|
|
|
| -
This was an increase of 731 GWh, or 5.7 %, compared to the previous month. |
|
|
|
| -
Combustible Fuels production showed the most significant percentage change
compared to the previous month with |
|
|
| a decrease of 42.6 %, or 78 GWh. |
|
|
|
|
|
|
|
|
|
|
|
|
|
|
|
| -
Total production for the year-to-date was 13 551 GWh. Comparing this to the
same period last year shows that: |
|
|
| - Total
production was higher by 1 354 GWh, or 11.1 %. |
|
|
|
| -
Combustible Fuels production showed the largest percentage change by fuel
type, being 22.1 % higher. |
|
|
| - Trade volume
decreased by 301 GWh, or 17.1 %. |
|
|
|
|
|
|
|
|
|
|
|
|
|
|
|
|
|
| Electricity
Production Compared to Previous Year |
'Year to Date'
Comparison of Production by Fuel Type |
|
|
|
|
|
|
|
|
|
|
|
|
|
|
|
|
|
|
|
|
|
|
|
|
|
|
|
|
|
|
|
|
|
|
|
|
|
|
|
|
|
|
|
|
|
|
|
|
|
|
|
|
|
|
|
|
|
|
|
|
|
|
|
|
|
|
|
|
|
|
|
|
|
|
|
|
|
|
|
|
| COUNTRY NOTES: |
|
|
|
|
|
|
|
| Net
production is estimated from monthly submission of gross production. |
|
|
|
|
|
|
|
|
|
|
|
|
|
|
|
|
|
|
|
|
|
|
|
|
|
|
|
|
|
|
|
|
|
|
|
|
|
|
|
|
|
|
|
|
|
|
|
|
| © OECD/IEA, 2008 |
|
|
|
|
|
|
|
|
|
|
|
|
|
|
|
INTERNATIONAL ENERGY AGENCY |
|
|
|
|
|
|
|
|
|
|
|
|
|
|
|
|
|
|
|
|
|
|
|
|
|
|
|
|
|
|
|
|
|
|
|
|
|
|
|
|
|
|
|
|
|
|
|
|
|
|
|
|
|
|
|
|
|
|
|
|
|
|
|
|
|
|
|
|
|
|
|
|
|
|
|
|
|
|
|
|
|
|
|
|
|
|
|
|
|
|
|
|
|
|
|
|
|
|
|
|
|
|
|
|
|
|
|
|
|
|
|
|
|
|
|
|
|
|
|
|
|
|
|
|
|
|
|
|
|
|
|
|
|
|
|
|
|
|
|
|
|
|
|
|
|
|
|
|
|
|
|
|
|
|
|
|
|
|
|
|
|
|
|
|
|
|
|
|
|
|
|
|
|
|
|
|
|
|
|
|
|
|
|
|
|
|
|
|
|
|
|
|
|
|
|
|
|
|
|
|
|
|
|
|
|
|
|
|
|
|
|
|
|
|
|
|
|
|
|
|
|
|
|
|
|
|
|
|
|
|
|
|
|
|
|
|
|
|
|
|
|
|
|
|
|
|
|
|
|
|
|
|
|
|
|
|
|
|
|
|
|
|
|
|
|
|
|
|
|
|
|
|
|
|
|
|
|
|
|
|
|
|
|
|
|
|
|
|
|
|
|
|
|
|
|
|
|
|
|
|
|
|
|
|
|
|
|
|
|
|
|
|
|
|
|
|
|
|
|
|
|
|
|
|
|
|
|
|
|
|
|
|
|
|
|
|
|
|
|
|
|
|
|
|
|
|
|
|
|
|
|
|
|
|
|
|
|
|
|
|
|
|
|
|
|
|
|
|
|
|
|
|
|
|
|
|
|
|
|
|
|
|
|
|
|
|
|
|
|
|
|
|
|
|
|
|
|
|
|
|
|
|
|
|
|
|
|
|
|
|
|
|
|
|
|
|
|
|
|
|
|
|
|
|
|
|
|
|
|
|
|
|
|
|