Also available in french [link], a complete textbook version.
| Contents |
FOREWORDEnterprises are at the heart of the production activities of all goods and services that human societies use to meet their needs. According to the history of the development of different communities and states organized with their own economic and legal institutions, the nature and mode of operation of these enterprises vary on the "institutional" level. Hence, there are private and public enterprises. For much of the 20th century, and especially during the four decades since the end of World War II, between democratic nations grouped around Britain, the United States and France on the one hand, the USSR on the second hand, that were at war with Germany and Japan, the world was divided into two ideological camps: capitalism and communism. An "iron curtain" separating the two camps was drawn and they clashed militarily and economically to exert their influence in different parts of the world. It was the "Cold War", as it was not quite war, but both sides exercised an "arms race" ever more sophisticated, to ensure the safety and hegemony of their camps. It is in these conditions that the United States took the lead in the capitalist camp and acquired a dominant position in most areas: scientific, technological, military and economic. During the 20th century, the activities of production of goods and services have increased considerably, particularly in the last decades of the century after the end of World War II. One can speak of an explosion in all areas: scientific, technological, economic and military. This explosion of activity occurred mainly in the countries of Western Europe and its offshoots - Canada, Australia, New Zealand - under the leadership of the United States, and also the Japan and the countries of Southeast Asia. In the late 1980s, the Soviet Union after 70 years of communism, collapsed and joined the camp of capitalism and market economy. Since then, conditions have been favorable for the global expansion of the market economy. Today we are witnessing the economic explosion of China and India on the one hand and the phenomenon of "globalization", ie the will of an increasing number of countries to join the market economy: companies can set up factories and manufacturing facilities worldwide. During the Cold War, it was almost impossible; firms in capitalist countries could not settle in countries under communist influence. Example, Tanzania, and India at the time of import substitution policies or pattern of self-reliant development through "cooperation agreements". Whatever rules the political system sets for operating in the economy, all enterprises are faced with constraints. The first is the volume of production and sales prices, quality and useful life of products but also the availability of raw materials and intermediate products (inputs), as well as other factors of productionie. labor and social security, technical processes and their with research and development and innovation. All this economic growth was driven by the quest to improve the quality of life in health, education, material well-being, leisure, etc ... for the people. Technically it is the development of energy, coal, oil and gas as well as electricity production, and transports by road, rail, air and sea and their associated infrastructures, household and leisure equipment, computers and communications that led to the world as it is today... these developments necessitated the increasing extraction of mineral resources of all kinds, energy (coal, lignite, oil and gas, uranium), iron and alloy metals, nonferrous metals (copper, lead, zinc, tin), precious metals (gold, silver, platinum, palladium), phosphates and potash salts, and many others including industrial minerals (limestone, lime, kaolin, clays). To achieve the objective of producing an adequate quantity of goods, in quality and in service life, ie. sustainably satisfying the needs of the market for those goods, without losses ie. without needing to draw on resources produced by others, but rather by increasing them, an enterprise needs to be economically viable: it must ensure that all its costs are balanced by its sales. Mineral resources are unevenly distributed over the planet. Their distribution does not correspond to nations. Mineral resources are non renewable; they deplete and have to be renewed to continue to serve needs and markets; or production has to expand or new mines found and opened to serve increased demand. Because mineral resources are unevenly distributed over the planet, major mining companies have global strategies with global asset portefolios. As exploited resources deplete, new resources tend to be more difficult to mine - deeper and lower grade - which means increased costs. This can be offset in some cases by technological progress or new resources eg. shale gas and oil, but the general trend is cost increase. See prices 3.7. Basic concepts for financial analyses:To understand the economic concepts that follow, it is necessary to define what is meant by the present value (PV) of a future income and by the Present Worth Value (PWV) of a series of future annual incomes. PV: present value of a future revenue.Present value is the reverse of future value. Future value of a saving put into a bank at beginning of year one, at an interest rate I% per year, is the value that will be obtained after so many years of its depositing. Present value is the reverse. It is the value that would have to be put into the bank at the beginning of year one, to obtain a given future value. Instead of an interest rate, on may refer to a discount rate. The present value (PV) in year 1, of an income of US$ 100 million expected for example in year 8, is the amount of capital, investment or saving, one should save 1.2in year 1, at a compounded interest rate, to obtain in year 8, principal repayment of US$ 100 million, plus accrued interest.
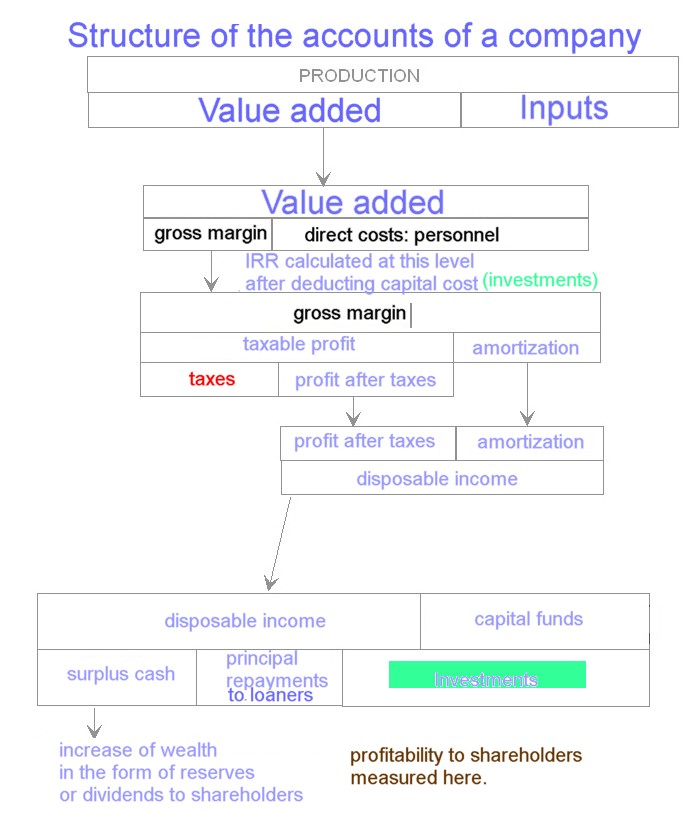
The interest rate adopted for these calculations is the rate for discounting future revenues. The discount rate is a more appropriate term than the interest rate, because it relates to the way future expected payments connect to the present. For this reason, interest rate or discount rate are used indifferently in the following. For an interest rate of 8% for example, the PV of an income of 100 million to be received in year 8 is 54 million ie. one should save 54 million from the beginning of year 1 to obtain 100 million at the end of year 8. The PV is 31.5 million for the same income received at the end of year 15 or 21.5 million if it is received at the end of year 20. The PV of a future income of 100 is increasingly lower for more distant earnings in the future which reflects the risk of foregoing present consumption for future consumption; see table 1.2. Likewise, with increasing interest/discount rate ie. the price demanded by the saver to forego his spending today, the PV decreases as the rate of interest increases; the higher the interest rate, the lower the PV ie. the amount of saving investment to be invested at the beginning of year 1. It is for this reason, that the interest rate is called the discount rate. The same table as above shows that the previous values decrease respectively to 40.4 million, 18.3 million, and 10.4 million, when the interest rate increases from 8% to 12%. Another way of showing this concept of PV and of the discount rate, is by drawing graphs as shown here: Note: By convention, we consider that the saving is invested on January 1 of the year and that the corresponding revenue is received on December 31 of the year, full years of foregoing of consumption. 92.6 million invested on January 1 of year 1 at 8%, gives an income of 100 million on December 31 of year 1 (92.6 + 8% = 100). Likewise, at 12% interest, it will be 89.3 million. PWV: Present Worth Value of a flow of future annual revenues.The Present Worth Value (PWV) of a series of future annual incomes at the interest/discount rate of 8% for example (PWV 8%) is the sum of the present values of a flow of annual revenues expected from a project. It is also called Net Present Value NPV, but to avoid confusion with the Present Value PV concept described above, I shall stick with PWV. It is the amount one should save at the beginning of year 1, to receive the series of annual revenues, for example, 100 million every year for 20 years or 2000 million undiscounted. For an interest rate of 0%, the PWV at 0% (PWV0%) is equal to the arithmetic sum of the series of annual revenues of 100. The higher the interest/discount rate, the lower the PWV because the PVs of the most distant revenues in the future are becoming smaller and smaller. For the flows of 100 million over 20 years at 8% interest, the PWV is 982 million. So, by saving/investing 982 million in year 1, we get 100 million annually during 20 years. See figure. In the case of 12% interest/discount rate, the PWV is 747 million, ie. it is obtained by investing 235 million less or 24% less. See this figure. Applied to a project or an operating business, we can say that investing 747 million in year 1 and getting an annual income of 100 million during 20 years, is as if we had saved and invested 747 million at a rate interest of 12%. Whereas by investing 982 million in year 1 and getting the same annual income of 100 million during 20 years, it is as if we had saved and invested at an interest rate of 8%. It is clear that getting an interest rate of 12% is better than 8%: it is 4 percentage points higher and we get the same annual income by saving and investing 235 million less or 24% less. The use of this saving investment is therefore more productive in absolute terms. Calculating IRR and PWV of projectsThis is the easiest, fastest and most useful method for financial analysis of a mining project. It is to establish the flow of future annual incomes, ie. the difference between the sales revenues of production, according to technical plans, and direct costs ie. costs of inputs, operating costs, costs of labour and staff; then to include the amounts of initial capital investments required as negative values. These data are produced by the technical study of the project ie. geology, quantities to be mined, process of production, capital and operating costs of plant and equipment required, manning of plant and equipment and their costs, overhead costs, direct taxes and royalties. The following starts from these basic data as produced by the technical studies which are the core of feasibility studies; consequently, financial studies are merely a "game of figures" based on those hard data. Gross operating profitGross operating profits are Earnings Before Income Tax Depreciation and Amortization (EBITDA) of the project year by year (see the structure of a company's accounts in this chart). This is the difference between annual sales of production at market prices and annual direct costs of operations which consists of inputs (consumption of intermediate products purchased externally, eg. electricity, fuels, spare parts, chemicals etc.), personnel costs, general and administration costs (G&A), taxes directly linked to production (fees and royalties calculated on the basis of tonnage or sales etc...). A three line schedule is then established with annual gross operating profit first, then capital expenditures; and thirdly net operating profits ie. the difference between gross profits and investment. The initial investment of a project is an important exceptional expense that is not repeated annually and must be considered for a sufficiently long length of time. The viability of an investment over the time frame of a project, depends on the choice of this length of time. And the latter depends on the amount of recoverable geological reserves, annual production envisaged, plant and equipment required to reach this production, resulting capital and operating costs ... so that the combination of capital, operating costs and revenues from production can be made - or rather has to be made - economically viable. The choice of the project time frame therefore requires some preliminary interaction between technical and economic studies. This can be achieved by means of the method of the internal rate of return (IRR) which we shall now review. The Internal Rate of Return IRR and the Present Worth Value PWV of a project are two facets of the same concept. Calculating the Internal Rate of Return (IRR)The internal rate of return (IRR%) is the interest/discount rate, such as the Present Worth Value (PWV) of the flow of gross operating profits generated by the project, equals the initial investment. In other words, PWV at IRR% of the flow of annual gross profits, is the value of the investment required to obtain this flow of gross profits. Another way of viewing this is to say that the IRR% is the rate of interest that makes the whole flow of all discounted costs and revenues nil. Whether this is economically viable or not, depends on what the investors expect in terms of revenues; and investors are both the sponsor(s) and operator(s) of the project and the financial institutions to which the former apply. See graphs showing the IRRs and PWVs of two examples (*): projectA: 200 million initial investment over 2 years and 55 million annual revenues over 20 years (projectA); and projectB: 150 million initial investment over 2 years and 20 million annual revenues over 20 years (projectB) and the two on the same graph [link] For projectA with an initial investment of 150 million spent in the first year, 200 million the second year and the annual gross margin of 55 million over 20 years from the year 3, the PWV at 8% discount rate is 153 million and the IRR is 13.8%. See Graph. For projectB with an initial investment of 100 million spent in the first year, 50 million the second year and the annual gross margin of 20 million for 20 years from the year 3, the PWV 8% is 33 million and the IRR is 10.8%. See Graph. The two examples projectA and projectB are further compared as shown on these two graphs giving the evolution of net PWVs of each project with increasing discount rate. The IRR% is at the intersection of the graphs with the horizontal axis, ie. when net PWV is zero. The two projects are compared in graph 8. This clearly shows project A to be better than project B. ProjectA generates more wealth than project B so it has more potential for sharing between the stake-holders: State for development, infrastructures and social expenses (through taxes), lenders (through interest payments) and equity owners (through surplus cash generated; on this more later). An interesting point, is that the PWVs of project A are always far above project B PWVs; but the difference decreases as the discount rate increases. After 16% discount rate, project B becomes better than project A. This reflects the higher sensitivity of big capital projects to the interest/discount rate. Benchmarking the IRR and PWV.The value of IRR obtained must then be benchmarked: whether it is good or not and by how much? Capital investments are made by savings. Sponsors and future owners of a project rarely have enough savings to invest the total amount required for the initial capital. They generally call for funds either on capital funds markets by selling shares or bonds or to banks for obtaining loans (*); or to both. We may compare the IRR calculated to an interest rate that we shall call the opportunity cost of capital on financial markets. This is the rate at which financial resources (for investing) are available through banks in the credit markets, at the time of implementing the project. If the IRR is below the opportunity cost of capital, then he project has no future. It is considered that the investment is first composed of capital brought by the owners or sponsors of the project; this is equity - non remunerated, therefore carrying risks for the owners. Second, by loans from financial institutions ie. commercial banks and/or international banks. The role of these, and of central banks that control them through monetary policy, is to stimulate economic activity by managing credit allocations and interest rates. The funds raised by these institutions come from various sources, including businesses and individuals having surplus cash ie. savings deposits for which they expect remuneration in the form of interest payments. Credit is also created by fractional reserve banking. Central banks play an important role in controling banks, a feature which is prominent today in the US, Japan and Europe, with zero interest rate policies and quantitative easing to bring their failing economies with massive unemployment back to growth. Because of this, official interest rates are low. But banks have to make their own assessements of projects that they are requested to finance, because in the case of default by the borrowers, their own activities and balance sheets are at risk. Technically, they do this by requiring higher equity to loan ratios, by assessing projects more critically and by adding management fees, risk premiums and inflation estimates to the interest they charge on loans. Because mining projects are long term projects with long term loans, with risks due to volatility of prices on the market, banks charge higher interest rates. The sponsors and owners of mining projects apply the same methods of assessement. Big mining companies have several mines in operation and they consider pooling to minimize risks for their basket of projects. This is an extract of pwc Australia on "global assets porteolio": "The level of growth in the mining industry correlates strongly with the growth of the broader global economy although with a noticeable lag in time. The globalisation of commodity markets now drives the approach to investment appraisal of major capital projects. Advancements in trade agreements, information systems, mining technology and human capital exchange are assisting mining companies of all sizes to diversify into an increasing range of countries and territories. Operating a global asset portfolio requires continual effort to be expended on portfolio optimisation. This is at its most complicated when considering major capital projects situated across both developed and developing nations." In this perspective, what is an acceptable internal rate of return? Calculations are made in constant value of money ie. without considering inflation of prices and costs over the life time of the project. Interest rates considered are real rates, without inflation. Interest rates that include inflation are nominal rates. Lenders and borrowers lend and borrow at nominal rates. Both have to assess what is the part that corresponds to the risk of inflation. A 5% real interest rate is considered by most economists as the normal rate. Bank administraive expenses are 1.5%. Over and above is risk premium. A PWV at 8% discount rate was considered in the golden years 1945-1975 for infrastructure projects eg. Electricity plants. A 12% discount rate adds 4% risk premium to that. I consider 12% as an IRR benchmark for most mining projects. So when IRR is greater than 12% one is on the safe side. Then strategy options of the mining company for its global assets portefolio come into play. The sovereign risk of the country is a major feature. What is the quality and record of the country with regard to respect of the mining code, mining convention for the project, tax policy and repatriation of surplus cash. If the record is low, the mining company will consider a higher benchmak ie. risk premium for the project. Stand alone projects have to be considered in the global strategy of the mining company. Sensitivity studiesSensitivity studies are changing prices or input costs like fuel and items of capital and operating costs and to calculate the effect of these changes on the IRR and PWV. Sensitivity studies are used to test the robustness of the financial model by changing key parameters which, if not correctly assessed, may cause failure of the feasibility study; they are:
Sponsors' view: operating statements and balance sheetsHaving established the IRR and PWV of the project reflecting its technical description, the next step is see to how the IRR and PWV are shared between State and Government who provide the institutional framework and necessary infrastructures, the lenders who provide credit by making available savings of their depositors, and the sponsors - the capitalists - who provide capital, techology and jobs but take the risks. In reality, it is all stake holders - state, lenders, sponsors - and the personnel - that bear the risks of the project, not just the capitalists. To build the necessay data for this, a schedule of sources and uses of funds for the project is used. Chart: Structure of a company's accounts (chart). Additional data than those required for calculating the IRR and PWV are necessary:
The schedule of sources and uses of funds as described in the Chart is detailed below:
The accumulated surplus cash should remain positive at all times. For this, it may be necessary to adjust the sources of funds; either by increasing equity or loans, but taking into account as a constraint, an acceptable equity/debt ratio. This ratio is usually 25-30%, ie. equity is at least 25-30% of equity+debt as fixed by loaners. Adjusting the sources of funds is generally required in the early years of the project due to buildup of production capacity which by necessity is gradual. The data of the "sources and uses" table are successive balance sheets of the project at each year end. Because the project starts from zero, the accumulated surplus cash is the net worth of the balance sheet for the equity owners. Moreover, Real world examples |
Put online for Ceseco 2015
![[link for 8%]](va_files/image001.gif)
![[link for 12%].](va_files/image002.gif)
![[link]](ECONO_files/image007.gif)