In March 2001, the Fresh Kills landfill, the local destination for New York City's daily output of 12,000 tons of garbage, was permanently closed. Now the garbage is hauled to distant sites in New Jersey, Pennsylvania, and Virginiasome of them more than 480 kilometers (300 miles) away. Assuming a load of 20 tons of garbage for each of the tractor-trailers that are used for the long-distance hauling, some 600 rigs are needed to remove garbage from New York City each day. These tractor-trailers form a convoy nearly 15 kilometers (9 miles) long, impeding traffic, polluting the air, and raising carbon emissions. This daily convoy of trucks leaving the city led Deputy Mayor Joseph J. Lhota, who supervised the Fresh Kills shutdown, to say that getting rid of the city's trash is now "like a military-style operation on a daily basis."(note 1)
What is happening in New York will occur in other cities if they also fail to adopt comprehensive recycling programs. Instead of focusing efforts on reducing garbage as the Fresh Kills landfill was filling, the decision was made to simply haul the garbage to more remote sites. Even a simple measure like recycling all its paper could shorten the daily convoy leaving the city by 187 tractor-trailers or 4.5 kilometers (2.8 miles). note 2
Fiscally strapped local communities are willing to take the garbage if New York pays enough. Some see it as a bonanza. For the state governments, however, that have to deal with the traffic congestion, noise, increased air pollution, and complaints from nearby communities, this arrangement is not so attractive. The Governor of Virginia wrote to New York Mayor Rudy Giuliani complaining about the use of Virginia as a dumping ground. "I understand the problem New York faces," he noted. "But the home state of Washington, Jefferson and Madison has no intention of becoming New York's dumping ground." Whether New York can continue to dump its garbage in others states over the long term remains to be seen. note 3
Earlier periods in human history were marked by the material that distinguished the erathe Stone Age and the Bronze Age, for example. Our age is simply the Material Age, an age of excess whose distinguishing feature is not the use of any particular material, but the sheer volume of materials consumed.
Worldwide, we process or use 26 billion tons of materials each year, including 20 billion tons of stone, gravel, and sand used for road building and construction; over 1 billion tons of iron ore processed for steelmaking; and 700 million tons of gold ore for extracting gold. From forests, we take 1.7 billion tons of wood for fuel, roughly 1 billion tons for wood products, and just over 300 million tons for manufacturing paper. To obtain phosphorus and potassium to replace the nutrients that our crops remove from soils, we annually mine 139 million tons of phosphate rock and 26 million tons of potash. note 4
Each of the earth's 6.1 billion inhabitants uses on average 137 kilograms (300 pounds) of steel per year in automobiles, household appliances, buildings, and other products. This means that each of us consumes nearly double our body weight in steel each year. Producing that steel means processing more than 340 kilograms of iron ore per person. note 5
The scale of the materials economy is far larger than most of us ever imagine, simply because we come in contact with only the final product we see, for example, the steel in our car or refrigerator, but not the tons of ore from which it was extracted, or we see the paper in our newspapers and stationery, but not the stack of logs from which it was processed.
The production of some seemingly innocuous items, such as gold jewelry, can be incredibly destructive. For example, the gold rings exchanged by couples during weddings require the processing of tons of ore, most likely by cyanide leaching. Worldwatch researcher John Young calculated that to create a pair of gold wedding rings, the ore processed is the equivalent of a hole in the ground that is 10 feet long, 6 feet wide, and 6 feet deep. Fortunately for the newlyweds, this hole is in someone else's backyard. So, too, is the cyanide used to separate the gold from the ore. note 6.
All the figures just cited are global averages, but the use of materialslike that of energy and foodvaries widely among societies. For example, steel production per person in the United States totals 352 kilograms annually; in China, it is 98 kilograms, and in India, just 24 kilograms. note 7
The processing of vast quantities of ore to produce metals is polluting local air and water. The energy use, the physical disruption of the land, and the pollution associated with processing ever growing quantities of ore are becoming less and less acceptable.
The sheer size of the materials economy is not only physically disruptive, it also uses vast quantities of energy. In the United States, the steel industry alone uses as much electricity as the country's 90 million homes. note 8
Building an eco-economy depends on restructuring the materials economy becauselike the energy economyit is in conflict with the earth's ecosystem. Architect William McDonough and chemist Michael Braungart talk about doing this. They describe an economy that is regenerative rather than depletive, one whose products "work within cradle-to-cradle life cycles rather than cradle-to-grave ones." In effect, this redesign means replacing the current linear flow-through model with a circular model that emulates nature, one that closes the loop. It means replacing mining industries with recycling industries, a step that will allow a mature, industrial economy with a stable population to live largely on the materials already in use. note 9
Two concepts that emerged during the mid-twentieth century have shaped the evolution of the global economy: planned obsolescence and throwaway products. Both were seized on enthusiastically in the United States after World War II as a way of promoting economic growth and employment. The faster things wore out and the sooner they could be thrown away, the faster the economy would grow.
For numerous consumer products, year-to-year changes in design became a key to stimulating sales. For automobiles, models changed each year. The unveiling of the new models, a major event on the economic calendars in leading industrial countries, automatically reduced the value of the previous year's cars. Model changes were intended not so much to improve performance as to sell more cars.
A similar situation exists with clothing, especially for women. Annual fashion shows trot out the latest designs. The changes for women's wear may involve raising or lowering hemlines, or emphasizing particular colors or fabrics in any given year. For many people, self-worth depends on wearing clothes that are "in fashion."
The throwaway economy evolved during the last half of the twentieth century. Throwaway products, facilitated by the appeal to convenience and the artificially low cost of energy, account for much of the garbage we produce each day and an even larger share of the material that ends up in landfills.
It is easy to forget how many throwaway products there are until we actually begin making a list. We have substituted facial tissues for handkerchiefs, disposable paper towels and table napkins for cloth, and throwaway beverage containers for refillable ones. In perhaps the ultimate insult, the shopping bags that are used to carry home throwaway products are themselves designed to be discarded. (The question at the supermarket checkout counter, "Paper or plastic?" should be replaced by, "Do you have your canvas shopping bag with you?")
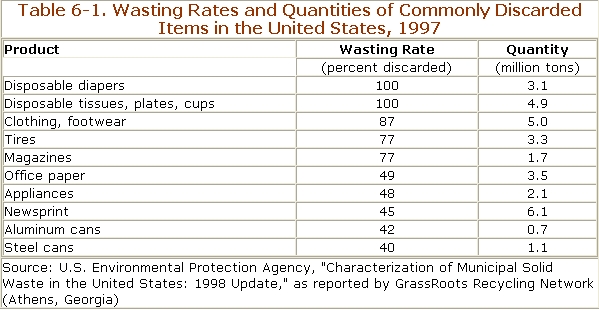
The U.S.-based GrassRoots Recycling Network has calculated the "wasting rates" of products that is, the share that is thrown away versus that recycled or reused. (See Table) Not surprisingly, products designed for disposal score the highest. By definition, the wasting rate of disposable diapers is 100 percent, as is that of disposable tissues, plates, and cups. Although Americans have markedly improved their record on newspaper recycling over the last decade or so, 45 percent of all newsprint is still discarded rather than recycled. Tossing newspapers is a way of converting forests into landfill.
The advent of disposable paper plates and cups, plus plastic "silverware," coincided with the emergence of the fast-food industry. The extraordinary growth of this sector helped ensure growth in the use of throwaway plates, cups, and eating utensils. These and other throwaways are routinely hauled by garbage trucks to landfills on a one-way trip through the economy.
Even while wrestling with traditional throwaway products, the world is now facing a new disposal challenge in desktop computers. Although they are not obsolescent by plan, the pace of innovation in the industry quickly makes them obsolete, giving the average computer a life expectancy of less than two years. In contrast to refrigerators, which are relatively easy to recycle, computers contain a diverse array of materials, many of them toxic, including lead, mercury, and cadmium, that makes them difficult to recycle. This helps explain why only 11 percent of computers are recycled, compared with 70 percent of refrigerators. note 10
A study by the Silicon Valley Toxics Coalition estimated that between 1997 and 2004, some 315 million computers would become obsolete in the United States alone. With each computer containing nearly 4 pounds of lead, the United States is facing the need to deal with 1.2 billion pounds of lead. While the world has been quite successful in getting it out of paint and gasoline, lead is still widely used in computers. Once in landfills, the lead can leach into aquifers and contaminate drinking water supplies. These same computers contain some 400,000 pounds of mercury and 2 million pounds of cadmium. note 11
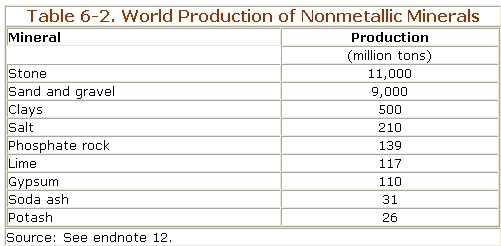
The materials used in our modern economy fall into three categories. The first is metals, including steel, aluminum, copper, zinc, and lead. The second category is nonmetallic minerals, such as stone, sand, gravel, limestone, and claymaterials that are used directly in the building of highways, roads, and buildings or in manufacturing concrete. This group also includes three mineralsphosphate, potash, and limethat are used in agriculture to raise soil fertility. (See Table) The final group of raw materials includes those of organic origin, such as wood from the forest sector and cotton, wool, and leather from agriculture. note 12
In the nonmetallic category, stone at 11 billion tons produced per year and sand and gravel at 9 billion tons a year totally dominate other minerals. But stone, sand, and gravel are usually available locally and do not involve long-distance transport. Used primarily for the construction of roads, parking lots, and buildings, these materials are chemically inert. Once stone or gravel is in place in a roadbed, it may last for generations or even centuries. note 13
This chapter concentrates on metals because their mining and processing are so environmentally destructive and energy-intensive. Their production uses seemingly endless quantities of energy to remove earth to reach the ore, extract it, transport it to a smelter, and then process it into a pure metal. What's more, much of this energy comes from coal, which itself must be mined. Over time, as high-grade ores have been depleted, miners have shifted to lower-grade ores, inflicting progressively more environmental damage with each ton of metal produced. note 14
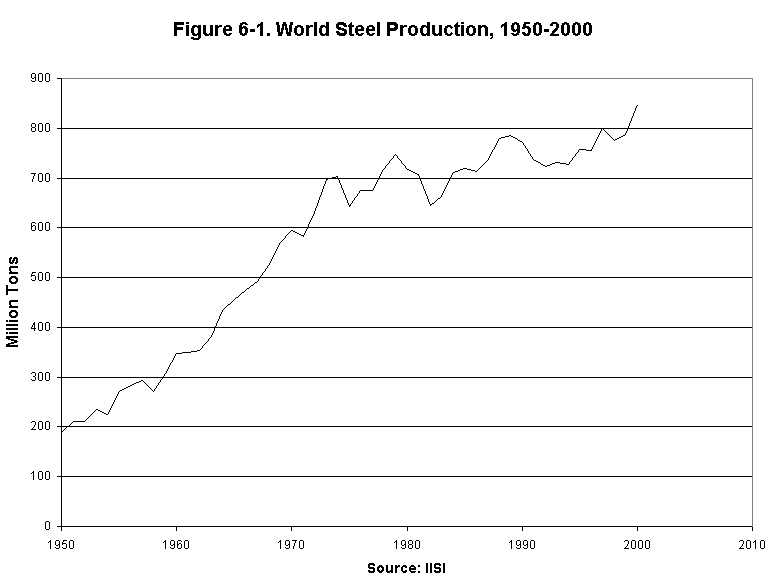
Ever since the Industrial Age began, steel production has been a basic indicator of industrialization and economic modernization. In the late twentieth century, the Soviet Union was the international steel giant. In the early 1990s, however, the breakdown of Soviet steel output paralleled the breakdown of the Soviet regime. Currently, China leads the world in steel production, followed by the United States and Japan. In quantity, the 833 million tons of raw steel produced each year (see graph) dwarfs the use of all other metals combined. It compares with 24 million tons of aluminum and 13 million tons of copper, the second and third ranking metals. While steel consists predominantly of iron, it is an alloy, and many of its attractive characteristics come from the addition of small quantities of other metals such as zinc, magnesium, and nickel. note 15
World steel production per person reached its historical high in 1979 and has since dropped by 20 percent. The decline reflects a shift to smaller cars, the partial collapse of the former Soviet Union economy, and a shift in the growth of advanced industrial economies from heavy industry to services, especially information services. note 16
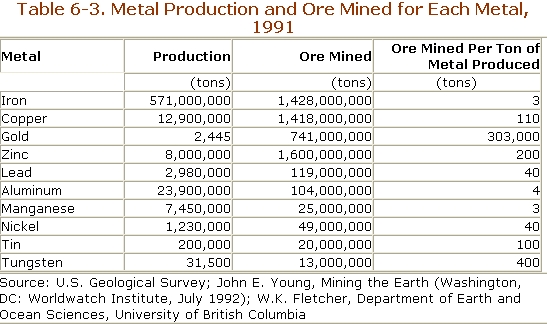
Every year, 1.4 billion tons of ore are mined worldwide to produce steel primarily for automobiles, household appliances, and construction. A comparable quantity of ore is mined to produce 13 million tons of copper. In an age when open pit mining has largely replaced underground mines, vast areas are physically disfigured. The mine tailings are then left behindoften disrupting the flow of nearby streams and contaminating water supplies. Anything that reduces the use of steel, particularly that produced from virgin ore, markedly lightens the human footprint on the earth.note 17
Although aluminum production is quite small compared with steel, the 24 million tons produced annually greatly understate aluminum's role because it is such a light, low-density metal. Australia produces one third of the world's aluminum-containing bauxite, with Guinea, Jamaica, and Brazil also contributing significantly to the world total. note 18
In the United States, well over half of all aluminum use is accounted for by the food packaging and transportation industries. For beverage containers, alternative materials such as glass can be used. However, aircraft, automobiles, and bicycles all currently rely heavily on aluminum.note 19
Much of the world's stock of aluminum, with its light weight and strength, is invested in the fleet of commercial planes. At any given time, a substantial fraction of the world's aluminum is actually airborne. With air travel expanding at 6 percent a year, the investment of aluminum in aircraft is also expanding.note 20
Although the use of aluminum in aircraft is well established, the substitution of aluminum for steel in automobiles is more recent, spurred by rising fuel prices and the desire for better gasoline mileage. Aluminum use in the average American automobile, for example, climbed from 87 kilograms in 1991 to 110 kilograms by the end of the decade. Although aluminum costs far more than steel, the lower weight of a vehicle with aluminum reduces fuel use, which over the lifetime of a car can more than offset the extra energy used to produce aluminum.note 21
Aluminum production exacts a heavy environmental toll as well, through both the mining and the smelting processes. Because aluminum typically occurs in thin layers of bauxite ore, extracting it by surface mining scars the landscape. For each ton of aluminum produced, a ton of "red mud"a caustic brew of chemicals--is left after the bauxite is extracted. This red muck is left untreated in large, biologically lifeless ponds, eventually polluting both surface and underground water supplies.note 22
But most of the damage done by aluminum production comes from generating electricity to run the smelters. Worldwide, the aluminum industry uses as much electric power as the entire continent of Africa. In some cases, the electricity for aluminum smelting comes from coal-fired power plants, but often it comes from hydroelectricity. Scores of dams have been built, particularly in remote regions, to produce cheap electricity to manufacture aluminum. Governments eager to build indigenous industry in their countries compete with each other for aluminum smelters by subsidizing the cost of electricity. As a result, aluminum is one of the world's most heavily subsidized raw materials.note 23
Among the metals, gold is distinguished by two thingsits minute production and vast environmental disruption. In 1991, producing a meager 2,445 tons of gold required the removal and processing of more than 741 million tons of orea mass equal to nearly two thirds of the iron ore used to produce 571 million tons of iron that year. (See Table) The leading gold producer is South Africa. Other producers include Australia, Brazil, Russia, and the United States. Eighty-five percent of the gold mined goes into jewelry.note 24
Beginning in the nineteenth century, gold was used to guarantee the value of paper currencies. As a result, much of the world's gold is stored in the vaults of national banks. Once the United States moved off the gold standard in 1971, however, many countries followed suit, and some have since sold gold from their vaults, including Australia, the Bank of England, the Netherlands, and the Swiss National Bank. This means that gold is being transformed from the final barometer of the value of paper currency to just another commodity. The Economist observes that gold is "the spent fuel of an obsolete monetary system." note 25
In damage per ton of metal produced, nothing comes close to gold. Each ton of gold requires the processing of roughly 300,000 tons of orethe equivalent of a small mountain. Over the last decade, a new technique of processing gold ore, called cyanide heap leaching, has come into widespread use. Cyanide solution is leached through a pile of crushed ore, picking up bits of gold as it passes through. This reduces the cost of gold mining, but it leaves behind toxic waste. Cyanide is so toxic that the ingestion of a teaspoon of 2 percent cyanide solution will lead to death within 40 seconds.note 26
In January 2000, a giant spill of 130 million liters of cyanide solution from a gold mine in Romania drained into the Tisza River, flowed through Hungary into Yugoslavia, merged with the Danube, and emptied into the Black Sea. The lethal solution from the Australian-operated mine left an estimated 1 million kilograms of dead fish in the Hungarian segment of the river alone. This cyanide spill, which left long stretches of river lifeless, has been called Europe's worst environmental disaster since Chernobyl. note 27 and see cyanide leaching spills
Cyanide spills have occurred in many countries. A similar incident in 1992 in the Alamosa River, a tributary of the Colorado River in the United States, killed everything in a 17-mile stretch and left the state of Colorado with a $170-million cleanup bill after the company responsible declared bankruptcy. note 28
See document "ban cyanide leaching"
and a A report submitted to the EU and the United Nations: An Assessment of Gaps in Cyanide Regulation at Mines
and Successful
resistance against Eurogold's Ovacik gold mining project near Bergama in Western Turkey
Another common mining technology uses mercury to extract gold from ore. Mercury accumulates in the environment, concentrating as it moves up the food chain. It was discharges of mercury into Japan's Minamata Bay a generation ago that demonstrated the brain damage and birth defects this heavy metal can cause.note 29
In the Amazon, gold miners release 200,000 pounds of mercury each year into the ecosystem, reports John Young. Although mercury levels in fish in the Amazon often exceed the levels for safe human consumption, people in the area have no alternative protein source. One teaspoon of mercury in a 25-acre lake can render fish unsafe for human consumption. No one knows when the effects of mercury intake will begin to show up as brain damage and birth defects in the Amazon, but we do know that they first appeared in Japanese infants roughly a decade after fertilizer plants began releasing mercury into Minamata Bay. note 30
Aside from the discharge of highly toxic cyanide and mercury into the ecosystem, gold mining is also a physically dangerous activity. In South Africa, where most of the gold comes from underground, death in the mines is routine, claiming one life for each ton of gold produced. note 31
Gold is not the only metal that is damaging the planet. The extraction of other metals, such as copper, lead, and zinc, also disfigures the landscape and pollutes the environment. Reducing this destruction of the natural landscape and the pollution of air, water, and soil depends on designing a new materials economy, one where mining industries are largely replaced by recycling industries.
No one knows exactly how many chemicals are manufactured today, but with the advent of synthetic chemicals, most of them organic in nature, the number of chemicals in use has climbed over 100,000. A random blood test of Americans will show measurable amounts of easily 200 chemicals that did not exist a century ago. note 32
A number of these chemicals are highly persistent and found in remote corners of the globe, far from their origin. Recent research at the Norwegian Polar Institute indicates that polar bears living within the Arctic Circle have high concentrations of persistent organic pollutants (POPs) in their fatty tissue. One apparent consequence of the buildup of POPs, some of which are endocrine disruptors, is that 1.5 percent of all female bears have deformed sexual organs. note 33
Most of these new chemicals have not been tested for toxicity. Those that are known to be toxic are included in a list of 644 chemicals whose discharge by industry into the environment must be reported to the U.S. Environmental Protection Agency (EPA). The annual publication of EPA's Toxic Release Inventory (TRI) makes public some of the more dangerous chemicals being put into the air or water or simply buried underground. Although these detailed data for the United States, compiled from reports submitted by industrial, mining, and electrical generating firms, are not readily available for most other countries, they do provide some sense of the global situation. note 34
In 1999, some 7.8 billion pounds of toxic chemicals28 pounds for each personwere released into the U.S. environment. Metal mining accounted for 4 billion pounds and electrical generating facilities for 1.2 billion pounds. The primary metals industry, which refines metals and manufactures metal products ranging from steel plates to copper wire and aluminum cans, released 684 million pounds of toxic chemicals. Compounds containing copper, zinc, and arsenic accounted for nearly three fourths of all the toxic chemicals released from these industries. The chemical manufacturing industry was close behind, with 671 million pounds. Paper manufacturing was third, with 226 million pounds of toxics released. note 35
For the electric utility sector, hydrochloric acid and sulfuric acid were among the leading toxics released. This does not include the emissions of sulfur dioxide and various nitrous oxides that interact with moisture in the atmosphere to form the sulfuric and nitric acid that damage respiratory systems and produce acid rain. While gold miners release an estimated 200,000 pounds of mercury into the Amazon ecosystem each year, coal-burning power plants release over 100,000 pounds of mercury into the air in the United States. EPA reports that "mercury from power plants settles over waterways, polluting rivers and lakes and contaminating fish." The risks to human health, and particularly prenatal damage to nervous system development, have led to restrictions on fish consumption in an estimated 50,000 U.S. freshwater lakes, rivers, and ponds. The 35,000 pounds of mercury deposited in New England each year from coal-burning power plants led the region's six states to warn children and pregnant women to limit their consumption of freshwater fish. A report by the National Academy of Sciences for the United States as a whole indicates that 60,000 infants may face neurological damage from mercury exposure before birth. note 36
The Toxic Release Inventory, now accessible on the Internet, also provides information on a community-by-community basis, arming local groups with data needed to evaluate the potential threats to their health and that of the environment. Since the TRI was inaugurated in 1988, toxic chemical emissions have declined steadily. note 37
Unfortunately, few other countries have instituted such comprehensive reporting procedures. And the U.S. system still has some gaps, such as on pesticides, which are released into the environment by farmers, homeowners, and golf course managers.
Some chemicals that are used in large quantities are lethal even in small quantities. For example, swallowing one teaspoonful of arsenic leads to death in less than a minute. Exposure to varying levels of toxic chemicals and in various combinations can lead to birth defects, impaired immune systems, damage to the central nervous system (including mental retardation), respiratory illnesses, a disruption of endocrine systems and hormonal balances, and cancer of almost every kind. note 38
Pollutants also damage the environment. Acid rain from sulfur dioxide emissions, for example, has damaged forests in industrial regions, including Europe, North America, and China. A 2000 survey reports that one quarter of Europe's forests are damaged. A nickel smelter in Norilsk, Siberia, has killed all the trees in a 3,500-square-kilometer area. Thousands of lakes in the northern tier of industrial countries are now lifeless because of acidification from acid rain. note 39
In some countries, environmental pollutants have accumulated to the point where they are reducing life expectancy. In Russia, the combination of a breakdown in the health care system, a dramatic rise in poverty over the last decade, and some of the world's highest pollution levels has helped reduce male life expectancy to less than 60 years. Horror stories of the health effects of uncontrolled industrial pollution in Russia are commonplace. For example, in the industrial town of Karabash in the foothills of the Ural Mountains, children routinely suffer from lead, arsenic, and cadmium poisoning. This translates into congenital defects, neurological disorders, and cancer. Pollutants also disrupt metabolic systems and impair immune systems. note 40
Developing countries, too, are beginning to suffer from uncontrolled pollution. Payal Sampat of Worldwatch Institute writes that the largest city in the agricultural state of the Punjab in northern India, Ludiana, is now paying the price for industrial pollution. A combination of industries, ranging from textiles to metal electroplating, has left the underground water supply contaminated with cyanide, cadmium, and lead. The well water on which the city's residents depend is no longer safe to drink. Other cities in India, such as Jaipur, and in China, such as Shenyang, that once depended on local groundwater supplies must now also seek water from elsewhere. note 41
Scientists analyzing underground water pollution quickly point out that thus far we are seeing only the tip of the iceberg, because it takes time for water-soluble toxic chemicals to percolate through the soil and eventually pollute underground aquifers. The toxics in underground aquifers today may be the product of industrial activities from a generation ago. note 42
The dispersal of some toxics is relatively new. This is the case in Japan, for example, where the incineration of municipal waste is discharging dioxins into the air. Dioxinswhich are so toxic that their presence is measured not in parts per million but in parts per billionare a product of burning plastic. Tokyo has become the dioxin capital of the world. Although Japan's emissions of dioxin, the highest of any country, total only 4 kilograms per year, they are at a level that could cause cancer or other maladies. note 43
One of the big challenges the world now faces is how to detoxify the earth. How do we make the air safe to breathe, the water safe to drink, and the soil safe for producing food? One important step was taken in December 2000 when delegates from 122 countries meeting in Stockholm approved a landmark agreement banning 12 of the most toxic chemicals now in use. These 12 persistent organic pollutants included pesticides, such as DDT, aldrin, endrin, chlordane, and dieldrin, as well as industrial chemicals like hexachlorbenzene and PCBs. Once 50 countries ratify the treaty, a process expected to take at least three years, then implementation will begin. Swedish Prime Minister Goeran Persson observed, "Dangerous substances do not respect international or national borders. They can only be fought with common strategies." Most countries have already banned the use of lead in gasoline, a common source of mental retardation in children. note 44
If we restructure the energy economy to stabilize climate (see Chapter 5), then the burning of coal for electrical generationthe source of the mercury that is making fish unsafe for human consumption, and the hydrochloric and sulfuric acids that are destroying forests and impairing respiratory systemswill largely disappear.
If recycling industries replace mining industries, the flow of pollutants will be greatly reduced. If countries ban the use of nonrefillable beverage containers, as Denmark and Finland have done, then both the amount of energy and the materials used in manufacturing beverage containers will be sharply reduced. In building an eco-economy, many of the goals are mutually reinforcing. note 45
As the economy metabolizes more and more metals and other raw materials, the damage mounts. Although recycling is typically justified as an economically attractive alternative to rising landfill costs, it also greatly reduces ecosystem damage.
As noted earlier, steel, copper, gold, and aluminum mining and processing account for much of the carbon emissions, pollutants, and landscape devastation associated with the materials economy. For recycling, the three materials to focus on are steel, copper, and aluminum, since the high value of gold virtually ensures that it is not discarded.
In terms of recycling potential, steelwith world output of 833 million tons per yearleads the list. Long a measure of industrialization, steel use is dominated by a few manufacturing industries, importantly automobiles and household appliances, and by the construction industry. Among the various products using steel in the United States, the highest rate of recycling is for automobiles. Cars today are simply too valuable to be left to rust in out-of-the-way junkyards. In the United States, nearly all discarded automobiles are recycled. note 46
The recycling rate for household appliances is estimated at 77 percent. For the construction industry, the recycling of steel beams and plates is even higher, some 95 percent; the steel used in reinforcing rods embedded in concrete, however, is not so easily recycled. For these and other construction uses, the recycling rate is 45 percent, according to the Steel Recycling Institute. For steel cans, the U.S. recycling rate in 1999 of 58 percent can be traced in part to municipal recycling campaigns launched in the late 1980s. note 47
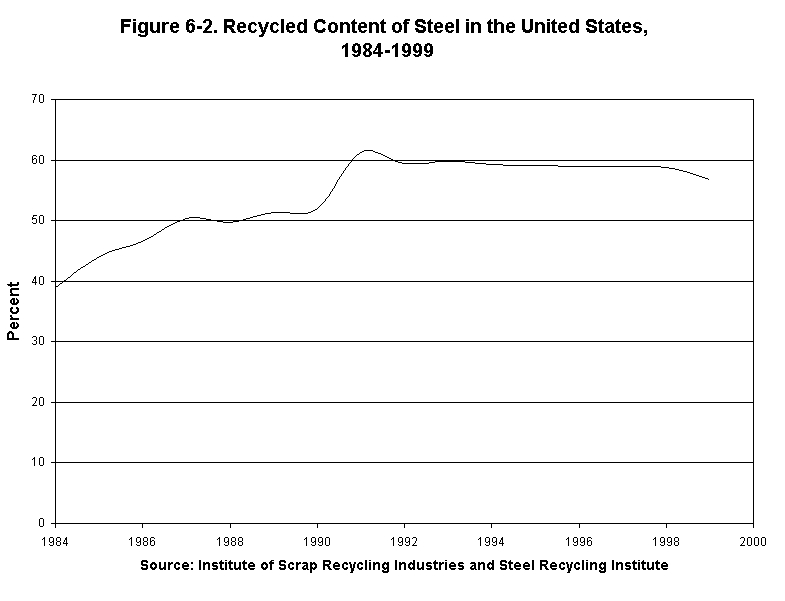
In the United States, roughly 58 percent of all steel produced in 1999 was from scrap, leaving 42 percent to be produced from virgin ore. (See Graph) Steel recycling started climbing more than a generation ago with the advent of the electric arc furnace, a highly efficient method of producing steel from scrap. Steel produced from scrap uses only one third as much energy as that produced from virgin ore. And since it does not require any mining of ore, it completely eliminates one source of environmental disruption. In the United States, Italy, and Spain, electric arc furnaces now account for half or more of all steel production. Over the last two decades, the U.S. steel industry has shifted from using largely virgin ore to feeding primarily on scrap metal. note 48
It is easier for countries with mature industrial economies and stable populations to get most of their steel from recycled scrap than it is for developing countries, simply because the stock of steel embedded in the economy is essentially fixed. The number of household appliances, the fleet of automobiles, and the stock of buildings is increasing little or none. In countries in the early stages of industrialization, however, the creation of infrastructurewhether factories, bridges, high-rise buildings, or transportation, including automobiles, buses, and rail carsleaves little steel for recycling.
As the U.S. steel industry has shifted to primary reliance on scrap, its geographic distribution has shifted. Once concentrated in western Pennsylvania, where there was an abundance of both iron ore and coal, the modern industry that uses electric arc minimills feeding on scrap is widely scattered across the country, in North Carolina, Nebraska, and Texas, for example. Minimills supply steel to local industries, enabling local communities to rely primarily on steel already in the system. note 49
The other metal with a pervasive environmental effect is aluminum. Some aluminum products are easily recycled. Others are not. For example, within the food industry, the aluminum foil used to package prepared frozen meals is not readily recycled. Aluminum beverage cans, by contrast, are much easier to take care of. In the United States, some 64 billion of the 102 billion aluminum cans used in 1998 were recycled. Yet this recycling rate of 63 percent is low compared with some other countries. In Japan, the current leader, 79 percent of aluminum beverage cans are recycled. Brazil is close behind, with 77 percent. In Japan, aluminum recycling is being driven by a scarcity of sites for garbage, whereas in many developing countries it is being driven by widespread unemployment. note 50
In Brazil, where unemployment is high, the recycling of aluminum beverage cans has become a major source of employment. An estimated 150,000 Brazilians make a living by collecting used beverage cans and taking them to recycling centers, earning $200 a month, compared with the minimum wage of $81 a month. Forty-five used cans can be traded for 1 kilogram of black beans, and 35 cans for a kilogram of rice. The system that has evolved in Brazil for recycling aluminum cans now employs more people than the automotive industry does. note 51
Despite the high recycling rate for cans, the overall aluminum recycling rate worldwide is not high. In the United States, the scrap share of aluminum production in 1998 was 33 percent. Roughly half of this was from scrap generated at the plants where various aluminum products are manufactured. Thus the amount recycled from consumer products containing aluminum was quite small. One reason for this is that investing aluminum in cars and airplanes is relatively recent, thus restricting the amount currently available for recycling. In contrast to worldwide steel use, which has increased little since 1973, aluminum production is still rising. note 52
The encouraging news is that the recycling of both steel and aluminum is increasing. The discouraging news is that neither is doing so fast enough. Far too much aluminum and steel end up in landfills.
As noted earlier, in the eco-economy societies will rely heavily on raw materials already in the system. For example, in the small, densely populated state of New Jersey, there are eight steel minimills that rely almost exclusively on scrap and 13 paper mills that use only waste paper. Collectively, these steel mills and paper plants market more than $1 billion worth of products each year, providing both local jobs and tax revenues. Ironically, these thriving steel and paper mills exist in a state that has no iron mines and little forested area. note 53
In an eco-economy, electric arc steel minimills that efficiently convert scrap steel into finished steel will largely replace iron mines. Advanced industrial economies will come to rely primarily on the stock of materials already in the economy rather than on virgin raw materials. For metals such as steel and aluminum, the losses through use will be minimal. With the appropriate policies, metalonce it is invested in the economycan be used indefinitely.
In nature, one-way linear flows do not long survive. Nor, by extension, can they long survive in the human economy that is a part of the earth's ecosystem. The challenge is to redesign the materials economy so that it is compatible with the ecosystem. This initiative has several components. It includes designing products so that they can be easily disassembled and recycled, redesigning industrial processes to eliminate waste generation, banning the use of throwaway beverage containers, using government purchases to expand the market for recycled materials, developing and using technologies that require less material, banning gold mining or at least its use of cyanide solution and mercury, adopting a landfill tax, and eliminating subsidies for environmentally destructive activities.
Some countries are adopting these measures. Germany and recently Japan have begun to require that products such as automobiles, household appliances, and office equipment be designed so that they can be easily disassembled and recycled. In May of 2001, the Japanese Diet enacted a tough appliance recycling law, one that prohibits discarding household appliances, such as washing machines, televisions, or air conditioners. With consumers bearing the cost of disassembling appliances in the form of a disposal fee to recycling firms, which can come to $60 for a refrigerator or $35 for a washing machine, the pressure to design appliances so they can be more easily and cheaply disassembled is strong. note 54
With computers becoming obsolete often within a couple of years as technology advances, the need to be able to quickly disassemble and recycle computers is a paramount challenge in building an eco-economy.
Another policy initiative that can greatly reduce materials use is the banning of one-way beverage containers, something that Denmark and Finland have both done. Denmark, for example, banned one-way soft drink containers in 1977 and beer containers in 1981. Canada's Prince Edward Island has adopted a similar ban on one-way containers. The result in all three cases has been dramatically reduced flows of garbage to landfills. note 55
The environmental costs of beverage containers vary widely. A refillable glass bottle requires less than one fifth as much energy as a recycled aluminum beverage container, assuming the bottle is refilled 15 times, which may be a conservative estimate. note 56
There are also large transport savings, since the containers are simply back-hauled to the original soft drink bottling plants or breweries. If nonrefillable containers are used, whether glass or aluminum, and they are recycled, then they must be transported to a factory where they can be melted down and refashioned into containers and transported back to the bottling plant or brewery.
Another area of potential reduction in materials use is the transportation sector. As cities redesign urban transport systems to better achieve social goals of increased individual mobility, clean air, less traffic congestion and frustration, and more opportunities for exercise, the use of cars will decline accordingly. (See Chapter 9.)
Even more fundamental than the design of products is the redesign of manufacturing processes to eliminate the discharge of pollutants entirely. Many of today's manufacturing processes evolved at a time when the economy was much smaller and when the volume of pollutants did not threaten to overwhelm the ecosystem. More and more companies are now realizing that this cannot continue and some, such as Dupont, have adopted zero emissions as a goal. note 57
Another way to reduce waste is to systematically cluster factories so that the waste from one process can be used as the raw material for another. NEC, the large Japanese electronics firm, is one of the first multinationals to adopt this approach for its various production facilities. In effect, industrial parks are being designed by corporations and by governments specifically to combine factories that have usable waste products. Now in industry, as in nature, one firm's waste becomes another's sustenance. note 58
Market incentives to recycle can be generated by government procurement policies. For example, when the Clinton administration issued an Executive Order in 1993 requiring that all paper purchased for government agencies contain 20 percent or more post-consumer waste by 1995 (increasing to 25 percent by 2000), it created a strong incentive for paper manufacturers to incorporate wastepaper in their manufacturing process. Since the U.S. government is the world's largest paper buyer, this provided a burgeoning market for recycled paper. note 59
A number of state governments achieved a similar goal by setting minimum recycled content standards for newsprint, reports John Young. He notes that the number of newsprint recycling plants in North America increased from 9 in 1988 to 29 in 1994. This created a market for recycled newspapers, converting them from an economic liability into an asset, something that could be sold. note 60
Dematerialization of the economy is facilitated by new technologies that are less material-dependent. Cellular phones, which rely on widely dispersed towers or on satellites for signal transmission, account for most of the growth in telephone use in developing countries. These nations will not need to invest in millions of miles of copper wires, as the industrial countries did. As recently as 1990, cellular phones were rare. But in 1996, cellular phone sales of 51 million overtook the 47 million new phones linked by wire. By 1999, cellular phone sales at 172 million nearly tripled the 63 million sales of fixed-line phones. There were 491 million cell phones in use by then, compared with 907 million traditional ones. By 2005, the number of cellular phones in use will probably exceed the number of telephones linked by wire. note 61
The new technology has arrived on the scene just in time for developing countries, such as China and India, which have few of the traditional linked telephones. Within just a few years, China has overtaken Japan in the number of cellular phone subscribers, trailing only the United States. We can now look forward to a world population linked by a phone network that does not require millions of tons of copper wire. note 62
Efforts to reduce materials use to date have been rather modest, consisting largely of recycling programs. In 1992, a group called the Factor 10 Institute was organized in France under the leadership of Friedrich Schmidt-Bleeck. Its goal is to increase resource productivity by a factor of 10, which they believe is well within the reach of existing technology and management, given the appropriate policy incentives. They recognize that increasing resource productivity by 10-foldthat is, reducing materials use by 90 percentwould "constitute a radical change from the traditional assumption that a healthy economy is one that uses increasing amounts of energy, materials, and resources to produce more goods, more jobs, and more income." Some reductions could be even greater; for example, replacing automobiles with bicycles to increase mobility in congested cities could lower materials use by more than 90 percent. note 63
Although relatively little attention is paid to the building construction industry, it is a leading user of material, including steel and cement. Simple measures like increasing the longevity of buildings can greatly reduce the use of these materials and of the energy used in their manufacture.
The brief review of gold mining in this chapter raises questions about whether the social benefits of gold mining exceed the ecological costs. Some 85 percent of all the gold mined each year is used to produce jewelry that is worn as a status symbol, often a way of displaying wealth by a tiny minority of the world's people.
Turkish environmentalist Birsel Lempke, a recipient of the Right Livelihood Award (often called the alternative Nobel), also questions the future of gold mining. As analyses provide more information on the ecological costs of goal mining, they raise serious doubts as to whether it is worth turning large areas into what Lempke calls "a lunar landscape." She indicates she is not against gold per se, but against the deadly chemicals, such as cyanide and mercury, that are released into the earth's ecosystem in processing the gold ore. note 64
If the costs to society of gold mining outweigh the benefits, then the question is how best to phase out gold mining. One way would be to put a tax on gold that would reflect the environmental costs to society, including the landscape disruption of processing over 700 million tons of ore annually, plus the cost to society of mercury and cyanide pollution. Such a tax would likely raise the price of gold several times. Another approach would be to simply negotiate an international ban on the use of cyanide and mercury in gold mining, much as the international community has recently banned use of a dozen toxic chemicals. Either policy approach could be used. Regardless of which one prevails, both current and future generations would be the beneficiaries. note 65
Another industry whose value to society is being questioned by the environmental community is the bottled water industry. The World Wide Fund for Nature (WWF), an organization with 5.2 million members, released a study in April 2001 urging consumers to forgo bottled water, observing that it was no safer or healthier than tap water, even though it can cost 1,000 times as much. note 66
WWF notes that in the United States and Europe there are more standards regulating tap water quality than that of bottled water. Although clever marketing in industrial countries has convinced many consumers that bottled water is healthier, the WWF study could not find any support for this claim. For those living where water is unsafe, as in some Third World cities, it is far cheaper to boil or filter water than to buy it in bottles. note 67
Phasing out the use of bottled water would eliminate the need for the fleets of trucks that haul the water and distribute it. This in turn would reduce the materials needed to manufacture the trucks as well as the traffic congestion, air pollution, and rising carbon dioxide levels associated with their operation. note 68
One of the most environmentally productive policy initiatives would be to eliminate subsidies that encourage the use of raw materials. Nowhere are these greater than in the electricity sector. In France, for example, the state-owned aluminum company gets electricity at the heavily subsidized rate of 1.5¢ per kilowatt-hour, while other industries pay 6¢ and residential users pay close to 12¢. In Canada, the government of Quebec also offers the aluminum industry electricity at 1.5¢ per kilowatt-hour. Without this huge subsidy, the industry probably could not profitably manufacture nonrefillable beverage containers. This subsidy to aluminum indirectly subsidizes transportation, including both airlines and automobiles, thus encouraging travel, an energy-intensive activity. note 69
The most pervasive policy initiative to dematerialize the economy is the proposed tax on the burning of fossil fuels, a tax that would reflect the full cost to society of mining coal and pumping oil, of the air pollution associated with their use, and of climate disruption. A carbon emissions tax will lead to a more realistic price for energy, one that will permeate the energy-intensive materials economy and reduce materials use.
The challenge in building an eco-economy materials sector is to ensure that the market is sending honest signals. In the words of Ernst von Weizsäcker, an environmentalist and leader in the German Bundestag, "The challenge is to get the market to tell the ecological truth." To help the market to tell the truth, for example, we need not only a carbon tax, but also a landfill tax so that those generating the garbage pay the full cost of getting rid of it and of managing the landfill and its potentially toxic waste flows in perpetuity. note 70
ENDNOTES:
1. Eric Lipton, "The Long and Winding Road Now Followed by New York City's Trash," New York Times, 24 March 2001.
2. Paper from U.S. Environmental Protection Agency, "Municipal Solid Waste Generation, Disposal and Recycling in the United States, Facts and Figures for 1998," source data and fact sheet (Washington, DC: April 2000).
4. U.S. Department of the Interior, U.S. Geological Survey (USGS), Mineral Commodity Summaries 2001 (Washington, DC: 2001); stone, sand and gravel, and clays from John E. Young, Mining the Earth, Worldwatch Paper 109 (Washington, DC: Worldwatch Institute, July 1992); fossil fuels in oil equivalent, from BP, BP Statistical Review of World Energy 2001 (London: Group Media & Publications, June 2001); wood figures from Emily Matthews et al., Pilot Analysis of Global Ecosystems: Forest Ecosystems (Washington, DC: World Resources Institute, 2000), pp. 27, 39.
5. Steel and iron ore production from USGS, op. cit. note 4; United Nations, World Population Prospects: The 2000 Revision (New York: February 2001).
6. John E. Young, "For the Love of Gold," World Watch, May/June 1993, pp. 19-26.
7. International Iron and Steel Institute (IISI), "The Major Steel Producing Countries," www.worldsteel.org, viewed 21 May 2001; United Nations, op. cit. note 5.
8. Hal Kane, "Steel Production Falls," in Lester R. Brown et al., Vital Signs 1993 (New York: W.W. Norton & Company, 1993), p. 76.
9. William McDonough and Michael Braungart, "The NEXT Industrial Revolution," The Atlantic Monthly, October 1998, p. 88.
10. Silicon Valley Toxics Coalition, Poison PCs and Toxic TVs (San Jose, CA: 2001); refrigerators from 77-percent appliance recycling rate in the United States, in Jim Woods, "Steel Recycling Rates Resume Upward Trend," press release (Pittsburgh, PA: Steel Recycling Institute, 7 April 2000).
11. Silicon Valley Toxics Coalition, op. cit. note 10.
12. Table 6-2 from USGS, op. cit. note 4, with stone, sand and gravel, and clays from Young, op. cit. note 4.
13. Young, op. cit. note 4, p. 9.
15. Soviet Union, United States, and China in IISI, op. cit. note 7; Figure 6-1 compiled from IISI; metals production from USGS, op. cit. note 4.
16. Historical steel production to 1995 from Hal Kane, "Steel Production Rebounds Slightly," in Lester R. Brown et al., Vital Signs 1996 (New York: W.W. Norton & Company, 1996), p. 79; current steel production of 833 million tons from USGS, op. cit. note 4; population from United Nations, op. cit. note 5.
18. John E. Young, "Aluminum Production Keeps Growing," in Worldwatch Institute, Vital Signs 2001 (New York: W.W. Norton & Company, 2001), p. 64; Australia and other countries from John E. Young, "Aluminum's Real Tab," World Watch, March/April 1992, p. 27.
19. The Aluminum Association, Inc., "Aluminum Facts at a Glance," fact sheet (Washington, DC: June 2000).
20. Lisa Mastny, "World Air Traffic Soaring," in Lester R. Brown et al., Vital Signs 1999 (New York: W.W. Norton & Company, 1999), pp. 86-87.
21. The Aluminum Association, Inc., "Aluminum: An American Industry in Profile" (Washington, DC: 2000), p. 2; Carole Vaporean, "Aluminum Moves to Third Place in Car Content," Reuters, 16 February 2001.
22. Young, "Aluminum's Real Tab," op. cit. note 18.
23. Electricity use by aluminum industry from Young, "Aluminum Production Keeps Growing," op. cit. note 18; African electricity use in 1999 from U.S. Department of Energy, Energy Information Agency, "World Total Net Electricity Consumption, 1990-1999," www.eia.doe.gov/emeu/iea/table62.html; Young, op. cit. note 4, p. 26.
24. Payal Sampat, "Gold Loses Its Luster," in Lester R. Brown et al., Vital Signs 2000 (New York: W.W. Norton & Company, 2000), pp. 80-81; 85 percent of gold in jewelry from "Don't Mine Gold for Jewels," Reuters, 10 December 2000.
25. Sampat, op. cit. note 24; "Central-Bank Gold: Melting Away," The Economist, 4 April 1992.
26. Young, op. cit. note 6, pp. 22-23.
27. "Hungary Seeks Millions in Damages for Cyanide Spill," Associated Press, 11 July 2000; worst since Chernobyl from "International Mining Groups Call for Worldwide Mining Law Reforms," press release (Washington, DC: Friends of the Earth, Mineral Policy Center, and Mineral Policy Institute, 15 December 2000).
28. Timothy Egan, "The Death of a River Looms Over Choice for Interior Post," New York Times, 7 January 2001; "Cyanide-Spill Suit Is Settled in Colorado," New York Times, 24 December 2000.
29. Young, op. cit. note 6, p. 25; Minamata Bay update in Peter Hadfield, "Court Win Follows 40 Years of Suffering," South China Morning Post, 2 May 2001.
30. John E. Young, "Gold Production at Record High," in Lester R. Brown et al., Vital Signs 1994 (New York: W.W. Norton & Company, 1994), pp. 82-83; Patricia Glick, The Toll From Coal (Washington, DC: National Wildlife Federation, April 2000), p. 9.
31. Roger Moody, "The Lure of Gold: How Golden Is the Future?" Panos Media Briefing No. 9 (London: Panos Institute, 1996).
32. Anne Platt McGinn, Why Poison Ourselves? A Precautionary Approach to Synthetic Chemicals, Worldwatch Paper 153 (Washington, DC: Worldwatch Institute, November 2000), p. 7; 200 chemicals in the body from Pete Myers, plenary discussion on Emerging Environmental Issues, at U.S. Agency for International Development Environmental Officers Training Workshop, "Meeting the Environmental Challenges of the 21st Century," Airlie Center, Warrenton, VA, 26 July 1999.
33. Alister Doyle, "Bears Take Brunt of Toxic Chemicals as Ban Looms," Reuters, 22 May 2001.
34. U.S. Environmental Protection Agency (EPA), Toxic Release Inventory 1999 (Washington, DC: 2001).
36. Mercury in the Amazon in "Mercury Poisoning Disease Hits Amazon Villages," Reuters, 4 February 1999; mercury emissions from U.S. coal plants in EPA, Office of Air Quality Planning and Standards and Office of Research and Development, Mercury Study Report to Congress Volume II (Washington, DC: December 1997), p. ES-4; mercury in rivers and lakes in Glick, op. cit. note 30; "EPA Decides Mercury Emissions from Power Plants Must Be Reduced," press release (Washington, DC: 15 December 2000); New England in Robert Braile, "Mercury Danger Rising, Group Says," Boston Globe, 19 September 2000; newborns in National Academy of Sciences, Toxicological Effects of Methylmercury (Washington, DC: National Academy Press, 2000).
37. "EPA Issues New Toxics Report, Improves Means of Reporting," press release (Washington, DC: 11 April 2001); TRI available on Internet at www.epa.gov/tri.
38. McGinn, op. cit. note 32, pp. 6-12.
39. European forest damage in U.N. Economic Commission for Europe and European Commission, Forest Condition in Europe 2000 (Hamburg, Germany: 2000); Norilsk from Koko Warner, An Emissions Tax in Siberia: Economic Theory, Firm Response and Noncompliance in Imperfect Markets (Laxenburg, Austria: International Institute for Applied Systems Analysis, 7 July 1997), pp. 1, 32, 37.
40. Sharon LaFraniere, "Mother Russia's Poisoned Land," Washington Post, 22 June 1999.
41. Payal Sampat, "Groundwater Shock," World Watch, January/February 2000, pp. 10-22.
43. "Japan Emits Most Dioxin Among 15 Nations: Study," Japan Times, 22 June 1999.
44. "Governments Agree to Ban or Limit 'Dirty Dozen' POPs," Bridges Weekly Trade News Digest (International Centre for Trade and Sustainable Development, Geneva), 12 December 2000; Persson quoted in "Toxic Chemicals Outlawed," Cable News Network, 22 May 2001.
45. Denmark and Finland in Brenda Platt and Neil Seldman, Wasting and Recycling in the United States 2000 (Athens, GA: GrassRoots Recycling Network, 2000).
46. Steel production from USGS, op. cit. note 4; automobile recycling rate from Woods, op. cit. note 10.
48. Figure 6-2 from Bill Heenan, Steel Recycling Institute, Pittsburgh, PA, e-mail to Earth Policy Institute, spring 2001; 33 percent from Gary Gardner, "Steel Recycling Rising," in Lester R. Brown et al., Vital Signs 1995 (New York: W.W. Norton & Company, 1995), pp. 128-29; Italy and Spain from Hal Kane, "Steel Recycling Rising Slowly," in Lester R. Brown et al., Vital Signs 1992 (New York: W.W. Norton & Company, 1992), p. 98.
49. Minimills in Kane, op. cit. note 16, pp. 78-79; "Government, Steel Maker Reach $98 Million Environmental Settlement," Cable News Network, 20 December 2000.
50. Can recycling in the United States from The Aluminum Association, Inc., "Aluminum Can Reclamation," fact sheet (Washington, DC: 2000); Fumiko Fujisaki, "Japan Aluminum Can Recycling Ratio up to 78.5 pct," Reuters, 14 July 2000; "Brazil's Poor Hunt Aluminum Cans as Swap for Food," Reuters, 17 October 2000.
51. "Brazil's Poor Hunt Aluminum Cans," op. cit. note 50.
52. The Aluminum Association, op. cit. note 19.
53. Brenda Platt and David Morris, The Economic Benefits of Recycling (Washington, DC: Institute for Local Self-Reliance, January 1993).
54. Tim Burt, "VW is Set for $500m Recycling Provision," Financial Times, 12 February 2001; Mark Magnier, "Disassembly Lines Hum in Japan's New Industry," Los Angeles Times, 13 May 2001.
55. Platt and Seldman, op. cit. note 45.
56. Based on John E. Young, "Refillable Bottles: Return of a Good Thing," World Watch, March/April 1991, p. 35.
57. Dupont will cut all material waste and emission of toxic substances to the environment, according to its "Safety, Health, and Environmental Commitment," as reported 15 April 1998 by University of California at Berkeley "People Product Strategy" program, at best.me.berkeley.edu/~pps/pps/dupont_dfe.html.
58. NEC Corporation, Annual Environmental Report 2000: Ecology and Technology (Tokyo: July 2000), pp. 24-27.
59. John E. Young, "The Sudden New Strength of Recycling," World Watch, July/August 1995, p. 24.
60. John Young, "The New Materialism: A Matter of Policy," World Watch, September/October 1994, p. 37.
61. Molly O. Sheehan, "Telephone Network Diversifies," in Brown et al., op. cit. note 24, p. 93; 1999 data from International Telecommunication Union, World Telecommunication Indicators 2000/2001 (Geneva, Switzerland: March 2001), pp. 11, 35.
62. "China is No. 1 in Asian Cell Phone Market," International Herald Tribune, 17 August 2000.
63. Friedrich Schmidt-Bleek et al., Factor 10: Making Sustainability Accountable, Putting Resource Productivity into Praxis (Carnoules, France: Factor 10 Club, 1998), p. 5.
64. Share of gold to jewelry and Lempke from "Don't Mine Gold...," op. cit. note 24.
66. Catherine Ferrier, Bottled Water: Understanding a Social Phenomenon (Surrey, U.K.: World Wide Fund for Nature, April 2001).
69. Young, "Aluminum's Real Tab," op. cit. note 18, pp. 26-33.