North and South America (with Greenland at upper right) can be seen represented in this 1975 coupled ocean-atmosphere model. The contours show the distribution of the rate of precipitation. Left: as actually observed. Right: as calculated by the model, roughly reproducing some key characteristics of the real world — Brazil wet, Southern California dry, etc. For the map of the entire earth (big file, 175kb) click here.
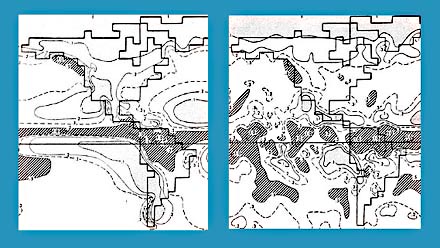
From S. Manabe et al., J. Physical Oceanography 5 (1975):3-29, p. 21.