.

 16.11.2002   16.11.2002   16.11.2002   16.11.2002   

I consider the results of the statistic study, included in MeMint, with the longitudinal data of the Young Adulthood Study, 1939-1967 to be conclusive about the genetic influence on intelligence (r2 till 0,99), the significance of the less powerful gene, important functionalities of the sexual diversification and about the existence of a teleological evolution.
In other words, most of the main previsions of the GTCEL.


Statistical Annexe

 16.11.2002   16.11.2002   16.11.2002   16.11.2002   

  .   .   .   .   .    .   

GTCEL free e-book (zip format)


Translate     Last update:   September 2002

GENERAL THEORY OF THE CONDITIONAL EVOLUTION OF LIFE
.

. Introduction.  


. Concepts of evolution, life and vital impulse systems.  


. Critic of the previous theories.  


. The evolution of life.  


. GTCEL - Definition, characteristics and conclusions.  


. Validation of the theory.  


.   Computer simulation.


. Theory implications.  


. Apendix.  


.   .   .  

This is a translation of a reduce version of the GTCEL e-book. (The full version is in Spanish)
It is explicitly forbidden to make unauthorized copies o prints (Except for students at school)
You may get the e-book from the download page

.   .   .  

 
© 2002, José Molina

.   .   .   .   .   .  

 
.

.        .    .    .    .

NOTE: The model of the inheritance of intelligence has been validated using the longitudinal data set of the Young Adulthood Study, 1939-1967. . (r2 = 0,96 and highers)

.

.

.

VALIDATION OF THE THEORY  

The proposed model assumes the following hypotheses:

  • Evolution with external verification of the genetic information transmitted for the capacity study object.

  • Existence of a function that measures the different potential from this capacity.

In order to facilitate the understanding of the model and its statistical analysis, we are going to choose the controverted and very studied subject of the inheritance of intelligence. Numerous studies based on measurements of the individual IQ or coefficients of intelligence exist.

The relation to other individuals estimates the generally accepted IQs, although many authors doubt these measurements and the unique concept of intelligence. So, the IQ refer to the relative position defined by means of a standardised function x (I) of the statistical distribution of the IQ studied for the process of validation of this function.

The studies have some contradictory conclusions, whereas in studies with identical twins a correlation of 80-85% is reached, for other types of familiar relations, decreases to a 30%. For me, the conclusion is that intelligence it is inherited as it demonstrates the high correlation between identical twins.

The low correlation in the rest of the cases is due to the incorrect definition of the form in which the inheritance is transmitted in agreement with the exposition of the GTCEL.

  .

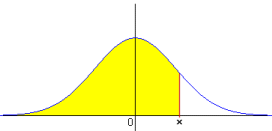
This figure shows the shape of the Normal function x(IQ), which we are going to use. For each IQ value, the function indicates the acumulated probability that the IQ of the population is equal or less than the first one.

For example x(100) = 0.5 and the opposite function xinv(Prob) = IQ, that means, xinv(0.5) = 100.

  .

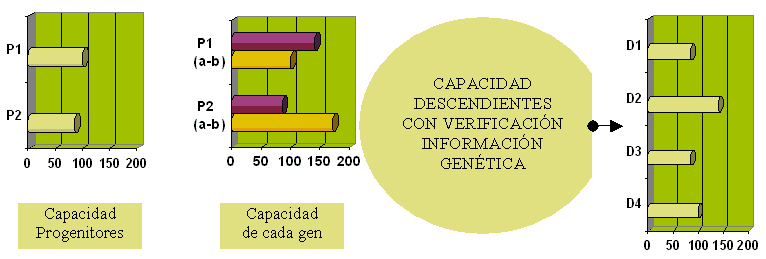
According with the values of the previous figure and using the Catell scale, mean 100 and standard deviation 24, we will have the following percentils:


Progenitor o Descendent Significant gen with VGI Percentil = x (IQ)
P1 P1b = 100 0.50
P2 P2a = 85 0.27
D1 P2a = 85 0.27
D2 P1a = (*) 0.95
D3 P2a = 85 0.27
D4 P1b = 100 0.50

(*) This value, although we know it from the previous figure, in fact, it is unknown because the significant gene of P1 is b; despite knowing the potential of D2, we will not know for sure if it comes from this gene or not.

This case has been chosen to show a general case, although the following reasoning can have many other possibilities it would be the same one or very similar for all of them.

The result of the combination of the four genes in agreement with the theory of Mendel will produce four different possibilities or cases. The mathematical expected average of the capacity of the new individual in agreement with the GTCEL will be the sum of the expected averages of each one of the cases weighed by its probabilities.

ECdescend. = P(D1) C(D1) + P(D2) C(D2) + P(D3) C(D3) + P(D4) C(D4)

In fact in our analysis are three cases because the first one has a probability of 50 %.

Considering that the assumption of verification of the received genetic information, assumed by hypothesis, says that the dominant gene will be the minor or even inferior to this one, since at the most it would only be possible to be contrasted the smallest in his integrity.

Despite this consideration, we will suppose for simplification that is contrasted in its totality since it is reasonable that for a specific capacity the greater gene contains practically all the information of the minor gene plus an additional part.

ECdescendant = 0.50 C(D1) + 0.25 C(D2) + 0.25 C(D4)

As C(D1) is always known and, in our case, equal to 85, we have:

ECdescendant = 0.50 85 + 0.25 C(D2) + 0.25 C(D4)

Another important aspect is that by hypothesis the gene (or the part of the genetic information that is associated to the studied capacity) more powerful of each ancestor cannot be measured since it is not expressed in his integrity since only the contrasted part will be expressed.

In other words, that agrees with less powerful. For that reason, it will be necessary to estimate its size the more precise we can. If we always worked with probabilities of the central value of its mathematical expected average, when calculating the correlation between dependent variables and independent ones, the errors will tend to compensate.

Although the most powerful gene could also be measured, the contrast problem would be similar by the randomness of the combination.

The genes in D2 are P1a y P2b, and in D4 are P1b y P2b. Out of this three gens we only know the potential of P1b equals 100; so, to estimate the potentials of D2 and D4 (ED2 y ED4) it will be necessary to estimate previously the potentials of P1a and P2b (EP1a y EP2b).

We could take EP2b as its expected value, that is, the mean of the values over the IQ of P2a. The potential associated with the percentile (xinv) the opposite function of x will obtain:

EP2b = xinv [x (P2a) + (1 - x (P2a) / 2)]

EP2b = xinv [0.27 + (1 - 0.27 / 2)] = xinv [0.635] = 108

The same way, EP1a will be:

EP1a = xinv [x (P1b) + (1 - x (P1b) / 2)] = 116

Now, we can continue the calculation of ED2 y ED4. The first one will depend on which of the values are smaller, EP1a or EP2b, and the second one, on the values of P1b and EP2b:

ED2 = EP2b = 108 because (EP1a > EP2b) or (116 >108)

ED4 = P1b = 100 because (P1b < EP2b) or (100 <108)

So, let's see the final estimation of the expected value for the potential of a singular descendant, before we said it would be:

ECdescendant = 0.50 85 + 0.25 C(D2) + 0.25 C(D4)

And with the correspondent estimations:

ECdescendant = 50% 85 + 25% 108 + 25% 100 = 94.5

Once the data of the sample studies is available it will be possible to analyse the correlation between the explanatory variables defined by the model with the explained ones.

The present model is a simplification for its presentation. For example, surely it would be necessary to include the internal improvement of the genetic information in each generation that could be superior to 10 %, in any case is possible to make preliminary studies for its estimation and later inclusion.

Another important aspect is the possibility of calculating the correlation of the IQ inheritance with half the cases, only those where the minor of the four genes is indeed the dominant one, that is to say, that the partial correlation of that 50% of the cases would have to be around 80-90% and the expected value should be centred and with a very small variance.

At the present time I am trying to be able to find the source data of previous studies to be able to make the statistical contrast.

.

.

.

.    .    .