|
| |
I consider the results of the statistic study, included in MeMint, with the longitudinal data of the Young Adulthood Study, 1939-1967 to be conclusive about the genetic influence on intelligence (r2 till 0,99), the significance of the less powerful gene, important functionalities of the sexual diversification and about the existence of a teleological evolution. |
|
| |
|
|
||||||
|
|
|
Translate Last update: September 2002 |
GENERAL THEORY OF THE CONDITIONAL EVOLUTION OF LIFE |
||
|
||||||
|
||||||
|
|
|||||
|
||||||
|
|
|||||
|
||||||
|
|
|||||
|
||||||
|
|
|||||
|
||||||
|
|
|||||
| ||||||
|
|
|||||
|
||||||
|
|
|||||
|
||||||
|
|
|||||
This is a translation of a reduce version of the GTCEL e-book. (The full version is in Spanish) |
|
NOTE: The model of the inheritance of intelligence has been validated using the longitudinal data set of the Young Adulthood Study, 1939-1967.
|
|
|
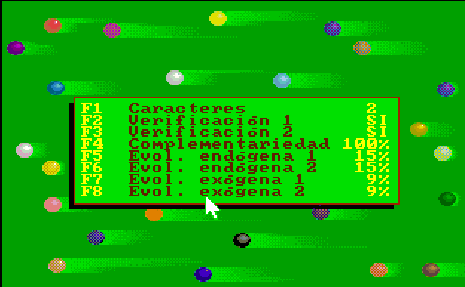
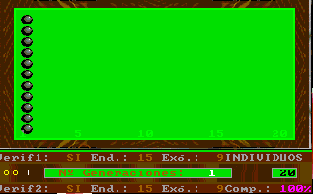
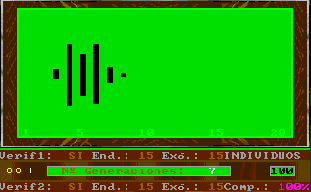
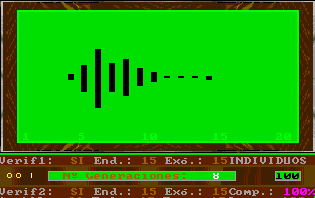
This option of Esnuka allows the observation of the changes produced by a specific number of generations for the whole population, for 20, 30 or 100 individuals. If Sound is off it will be set to 100. The difficulty level parameter controls the way to calculate the potential of genes. For difficulty levels 1 and 2 the initial values of the potential of the genes are randomly calculated within a limit of 1 to 3 and are independent from each other. Otherwise, for values 3 and 4 the potential of the genes of an individual is equal. This characteristic hardly affects the evolutionary process, however in the latter case, the values tend to be less extreme within their range. This option appears on the screen with two different or equal sized circles respectively. Nevertheless, if the colour inversion function is activated, all the genes will be set up with the same value and this is shown on the screen by one circle. The difficulty level parameter is also used to decide which simulation rules to use in accordance with either Esnuka I for values 1 and 3 or Esnuka II for values 2 and 4.This is represented by one or two vertical lines on the screen. When simulation is requested, a screen will appear displaying a randomly calculated initial situation within a limit of 1 to 5; in other words, the left-hand side of the evolution screen. The balls will depend on the configuration of the fixed verification and complementary parameters. Every time a key is pressed, a new generation will be calculated according to the parameters established in the configuration menu. These parameters are constantly displayed on the screen.
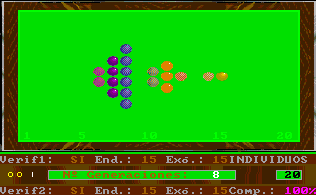
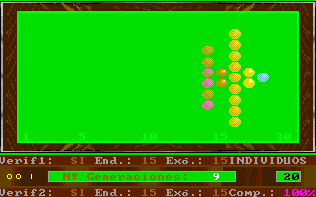
The detail of each individual evolutionary step is identical to the one used in Esnuka I and II, the rules governing the interchange of genes are Mendel's established theories and the probabilities of transmission are equal for each gene. In this way, the effect on evolution of genetic verification concepts and complementary characters can be seen. In particular, the selection of external verification means that the figures resemble the tip of an arrow; if complementary genes are added the figure slightly changes its shape, to remind us on occasion of fractals. The speed of evolution depends on its parameters and is the same with or without external verification; nevertheless the former case will be out of step compared with the latter. Another visible effect is the increase in distance between individuals when internal evolution parameters are small compared to external evolution parameters and vice versa.
By fixing very small endogenous and exogenous evolutionary parameters we can study the behaviour of evolution in the long term, this is equivalent to increasing dimensions of the evolutionary window without changing the evolutionary parameters. Differences between consecutive colours are always constant and endogenous and exogenous evolutionary parameters are expressed in percentages. As an additional explanation, we could say that colours are always standardised in the scale 1 to 20, therefore, the potential represented by colours is the same in the cases of genes, characters and individuals, the only exception being individuals with complementary characters. For example, the potential of an individual with two complementary characters with potential equal to 10 will be 10 times 10 = 100, divided by 20 = 5, to standardise the range 1 to 400. |
|


